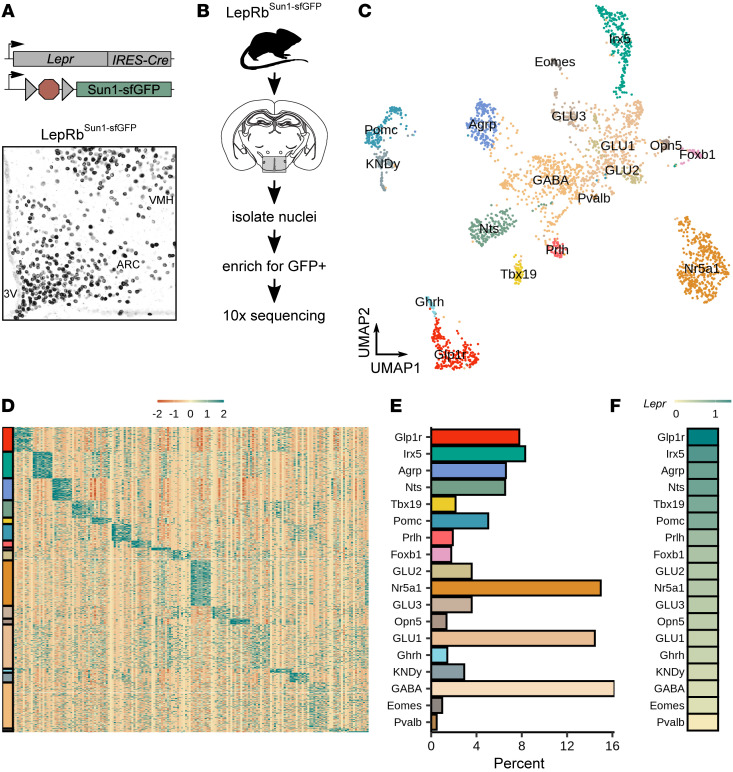
Figure 1. snRNA-Seq of FACS-enriched hypothalamic LepRb neurons defines known and novel LepRb neuron populations.
(A) Genetic diagram for the LepRbSun1-sfGFP mouse line (top), and representative image showing GFP immunoreactivity (black) in the mediobasal hypothalamus of a LepRbSun1-sfGFP mouse (bottom). 3V, third cerebral ventricle. Original magnification, ×10. (B) Experimental diagram for isolation of LepRb nuclei from the hypothalamus for snRNA-Seq. (C) UMAP projection of all 2,879 hypothalamic LepRbSun1-sfGFP neuronal nuclei, colored by cluster. (D) Scaled expression of top marker genes across all cells; colors on left correspond to colors of populations, as in C and E. Lowest expression was set to –2; highest expression was set to 2. (E) Percentage of cells that map to each cluster. (F) Scaled Lepr expression across neuron populations within the LepRb-Sun1 data set. Expression in glia was set to 0 and highest Lepr expression was set to 1.

