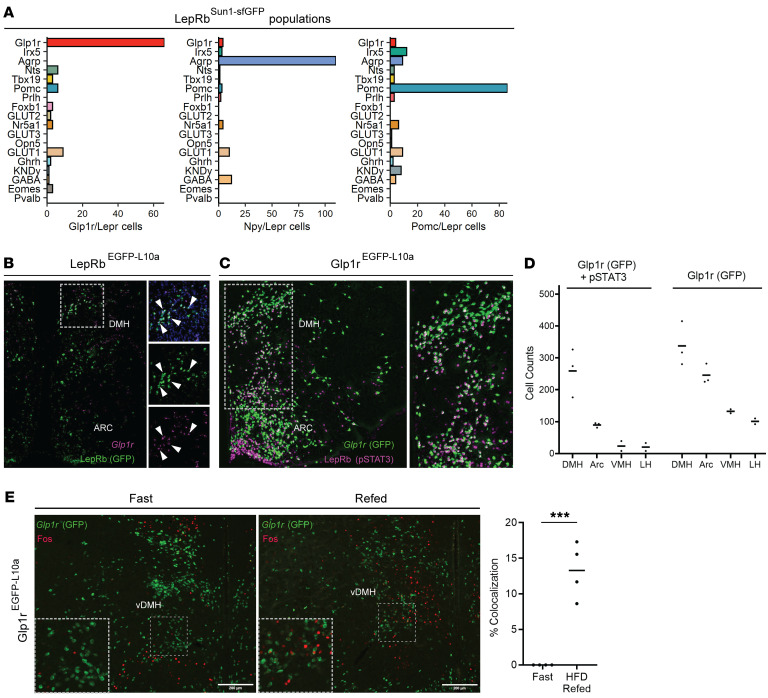
Figure 2. Predominant DMH localization of LepRbGlp1r cells.
(A) The number of Glp1r- (left), Npy- (middle), and Pomc-expressing (right) cells across LepRbSun1-sfGFP populations. (B) Representative image showing in situ hybridization for Gfp [LepRb(GFP), green] and Glp1r (magenta) in the hypothalamus of a LepRbEGFP-L10a mouse. Digital zooms of Glp1r (bottom), Gfp (middle), and merged images (top) are shown. Arrowheads indicate cells demonstrating colocalization. Original magnification, ×4. (C) Representative image showing GFP immunoreactivity (-IR) (green) and pSTAT3-IR [LepRb(pSTAT3), magenta] in the hypothalamus of a leptin-treated Glp1rEGFP-L10a mouse. Original magnification, ×4. A digital zoom of the boxed region is shown. (D) Quantification of cells containing GFP+pSTAT3 or GFP alone across hypothalamic nuclei in mice treated similarly as those shown in C (n = 3 male animals were assessed). (E) Representative images of the DMH showing FOS-IR (red) and Glp1r (GFP) in fasted (left; n = 3 male and 1 female animal) or fasted and refed with high-fat diet (right; n = 2 male and 2 female animals) Glp1rEGFP-L10a mice. Original magnification, ×4. Insets show digital zooms of the boxed regions. Quantification of FOS+GFP/GFP neurons is shown in the graph. Scale bar: 200 μm. ***P < 0.001 by Student’s t test.

