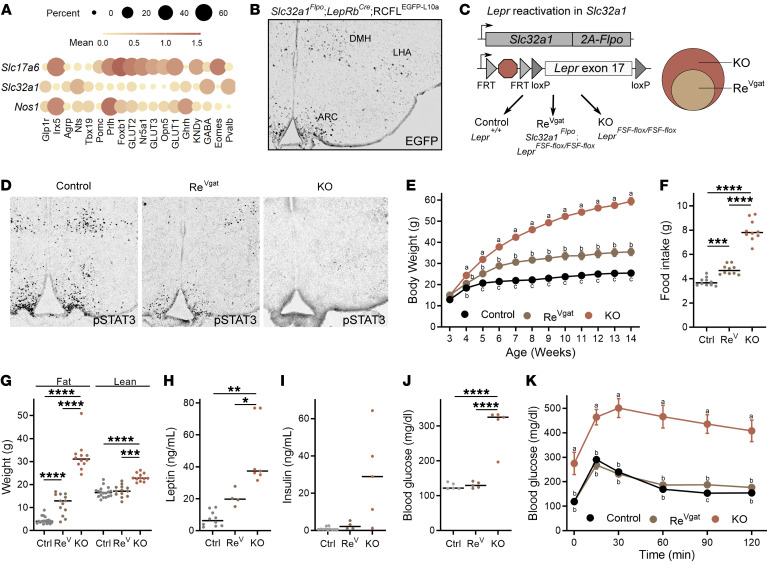
Figure 4. Lepr expression in GABAergic LeprGlp1r cells suffices for most leptin action.
(A) Expression of Slc17a6 (vGlut2), Slc32a1 (vGat), and Nos1 for LepRbSun1-sfGFP populations. (B) Representative image of GFP-IR (black) in the hypothalami of Slc32a1Flpo;LepRbCre mice on a Flp- and Cre-dependent reporter (RCFLEGFP-L10a) background. (C) Generation of control, LeprFSF-fl/FSF-fl (KO), and Scl32a1FlpO;LeprLSL-fl/LSL-fl (ReVgat) mice to test the role of Lepr in GABAergic neurons for leptin action. (D) Representative images showing leptin-stimulated pSTAT3-IR in control, ReVgat, and KO mice. (E–K) Body weight (E; n = 11 Ctrl, n = 6 ReVgat, n = 6 KO male and n = 11 Ctrl, n = 9 ReVgat, 6 n = KO female animals), food intake (F; n = 11 Ctrl, n = 6 ReV, n = 6 KO male and n = 11 Ctrl, n = 9 ReV, n = 6 KO female animals), body composition (G; n = 10 Ctrl, n = 5 ReV, n = 6 KO male and n = 8 Ctrl, n = 8 ReV, n = 6 KO female animals), serum leptin (H; n = 5 Ctrl, n = 2 ReV, n = 4 KO male and n = 5 Ctrl, n = 2 ReV, n = 3 KO female animals), serum insulin (I; n = 5 Ctrl, n = 2 ReV, n = 2 KO male and n = 6 Ctrl, n = 3 ReV, n = 2 KO female animals), blood glucose (J; n = 11 Ctrl, n = 6 ReV, n = 6 KO male and n = 11 Ctrl, n = 9 ReV, n = 6 KO female animals), and glycemic response to i.p. glucose tolerance test (K) in control (gray; n = 10 male, 9 female), KO (orange; n = 4 male, n = 5 female animals), and ReVgat (gold; n = 6 male, n = 9 female) mice. In H–J, all mice were ad libitum fed in the AM. Data in E and K show the mean ± SEM; letters a–c signify conditions that are statistically different (P < 0.05) by ANOVA with Tukey’s post hoc test. For F–J, *P < 0.05; **P < 0.01; ***P < 0.001; ****P < 0.0001 by ANOVA with Dunnett’s post hoc test.

