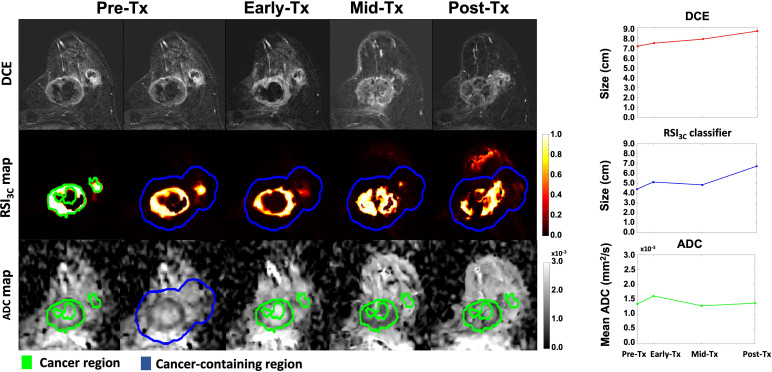
Figure 3.
DCE, RSI3c maps, and ADC maps with corresponding size (manual DCE measurement and RSI3C classifier) and mean calculation (ADC) for all four time points for a non-responding subject with remaining tumor tissue on final post-surgical pathology. Tx, treatment; DCE, dynamic contrast-enhanced MRI; RSI3C, three-component Restriction Spectrum Imaging model; ADC, apparent diffusion coefficient.

