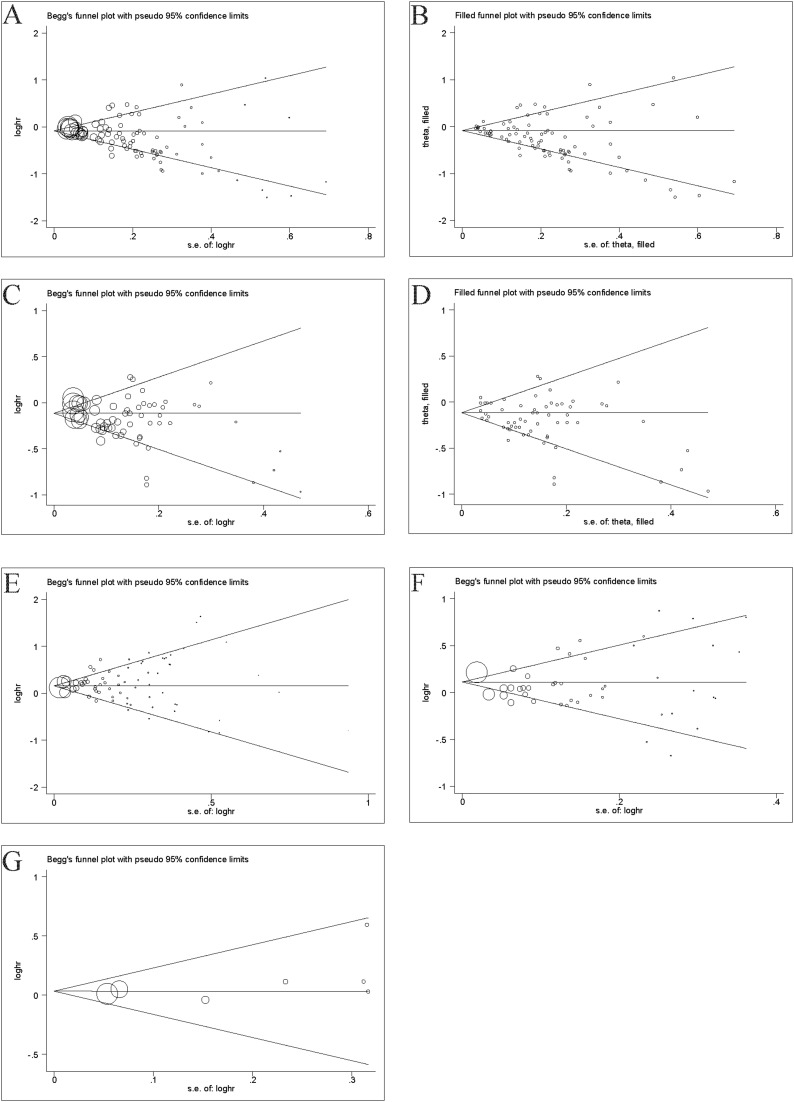
Figure 3.
(A) Begg’s funnel plot of healthy diet with asthma in cross-section studies. (B) Filled funnel plot of healthy diet with asthma in cross-sectional studies. (C) Begg’s funnel plot of healthy diet with wheeze in cross-sectional studies. (D) Filled funnel plot of healthy diet with wheeze in cross-sectional studies. (E) Begg’s funnel plot of unhealthy diet with asthma in cross-sectional studies. (F) Begg’s funnel plot of unhealthy diet with wheeze in cross-sectional studies. (G) Begg’s funnel plot of unhealthy diet with wheeze in cohort studies.

