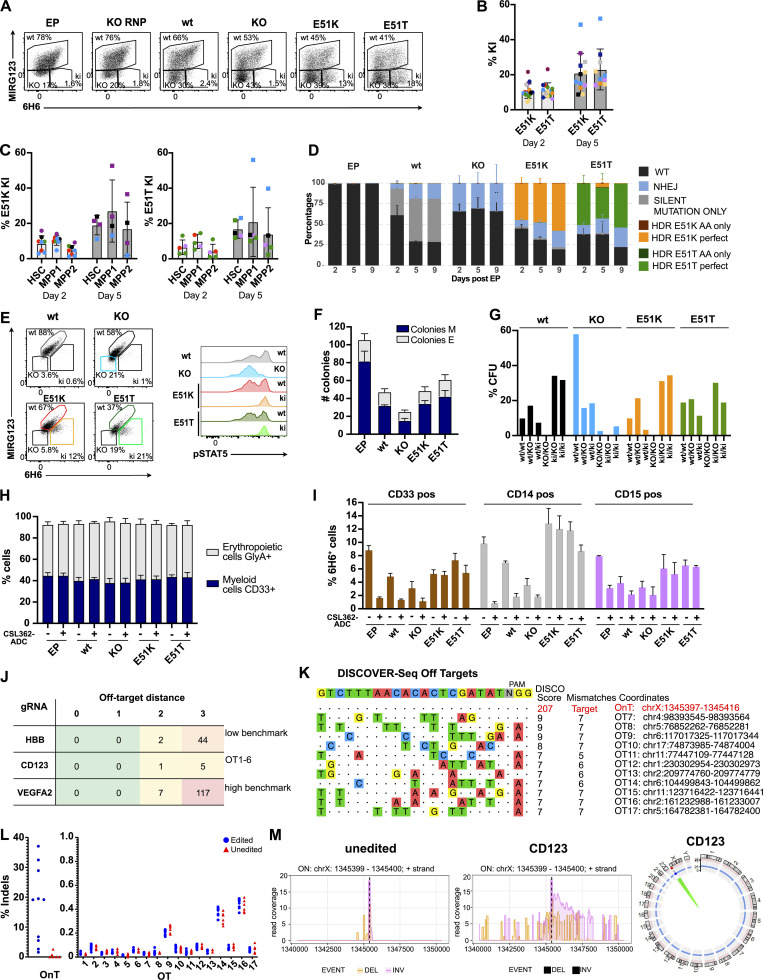
Figure 5.
HSPCs expressing CD123 variants E51K and E51T are functional, differentiate normally in vitro, and display a good safety profile. (A–M) Characterization of non-virally CRISPR/Cas9-edited human CD34+ HSPCs. (A) Representative flow cytometry plots showing binding (%) of the anti-human CD123 antibody clones 6H6 and MIRG123 to edited CD34+ HSPCs 5 d after EP. EP (cells electroporated with Cas9 protein only); KO RNP (EP with RNP only); wt, KO, E51K, and E51T variants (electroporated with respective HDRT). In flow cytometry, cells double-positive for MIRG123 and 6H6 were defined as "wt," whereas MIRG123−6H6− are indicated as “KO” although they include intended CD123 KO cells as well as cells naturally not expressing CD123. The MIRG123−6H6+ cell population is labeled as KI. Representative plots of five independent experiments each performed with different donors. (B) Frequency of ki cells (MIRG123−6H6+) 2 and 5 d after EP. Data from eight individual donors (each a color) were performed in six independent experiments with two to four technical replicates. (C) Quantification of the ki population in LT-HSCs (CD34+CD38−CD90+CD45RA−), multipotent progenitor 1 (MPP1; CD34+CD38−CD90−CD45RA−) and MPP2 (CD34+CD38−CD90−CD45RA+). (D) Representative Amplicon-NGS sequencing of the targeted CD123 locus at 2, 5, and 9 d after editing of control (EP), wt template, KO template, E51K, and E51T conditions. Data from four different experiments performed with different donors were pooled. (E) Representative FACS plots of CD123 stained with 6H6 and MIRG123 (left) and histograms of phosphorylated STAT5 (right) upon exposure to IL-3 in non-virally edited HSPCs. Color-coding in FACS plots and histogram is identical. Data are representative of four independent experiments. (F) In vitro differentiation of CD123-engineered HSPCs assessed by the number of colony-forming units (erythroid: E, myeloid: M). CFU were scored using STEMVision based on morphological characteristics. A representative experiment of two independent biological replicates performed in duplicates. (G) Allele frequency of the CD123-engineered HSPCs in a minimum of 38 colonies. (H) Frequency of GlyA+ and CD33+ non-virally edited HSPCs cultured in high cytokine medium with or without CSL362-ADC for 14 d. Myeloid lineage: CD33+, erythroid lineage: GlyA+. Data are from three experiments performed in triplicates. (I) Frequency of 6H6+ CD123-positive cells in the CD33+, CD14+, or CD15+ subsets. A representative experiment of two independent experiments performed in triplicates. (J) Computational off-target prediction. HBB and VEGFA site 2 as benchmarking gRNAs. On-target (OnT), off-target (OT1-6). (K) DISCOVER-Seq in KO RNP edited HSPCs. On-target (OnT), off-target (OT7-17). (L) rhAMPSeq validation of computational prediction and DISCOVER-Seq analysis. Shown are the editing rates as percentage of indels detected at the on-target (OnT) site and at the 17 off-target (OT) sites. Blue circles: Edited category comprises samples treated with gRNA for CD123 (KO RNP, KO template, E51K, and E51T). Red triangles: Unedited category comprises samples not treated with gRNA for CD123 (HSC, EP). Data are from one experiment performed with six samples generated in six independent editing experiments with cells from different donors. (M) CAST-Seq in unedited (left) and KO RNP edited HSPCs (center). Coverage plots of the on-target site in CD123 indicate large inversions (pink line) and deletions (orange line), respectively. Circos plot is used to illustrate chromosomal translocations. Data are from one experiment performed with two independent samples. Error bars: mean (SD).

