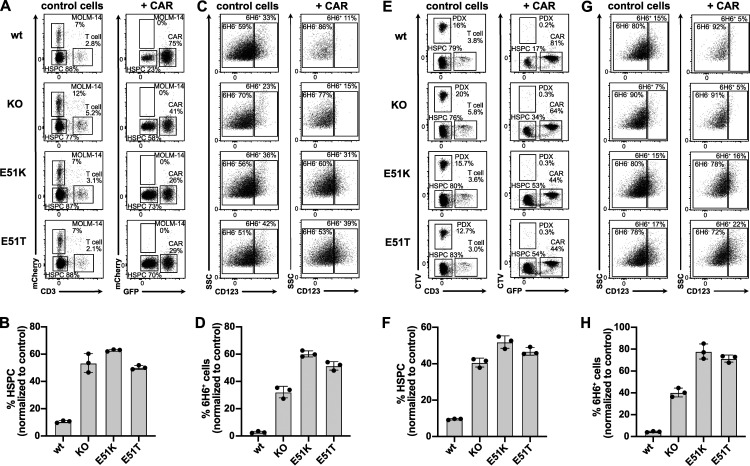
Figure 7.
Engineered HSPCs enable tumor-selective CD123 immunotherapy. (A–D) Non-virally edited HSPCs co-cultured with MOLM-14-mCherry (AML cells) and control T cells (control cells) or 123CAR (+CAR) for 2 d. (A) Representative dot plots indicating proportion (%) of CD3+ T cells (control cells and CAR, respectively), MOLM-14 cells, and non-virally edited CD34+ HSPCs on day 2 of co-culture. (B) The proportion of HSPCs based on absolute counts from A normalized to the number of control T cells. (C) FACS plots illustrating the proportion (%) of wt or ki HSPCs at the end of the co-culture based on the binding characteristics to the mAb 6H6. Only clone 6H6 was used to avoid epitope masking by the 123CAR. (D) Fraction of 6H6+ cells based on absolute numbers from C relative to co-culture with control T cells. (E–H) Non-virally edited HSPCs co-cultured with PDX (CTV labeled) and control T cells or 123CAR for 2 d. (E) Representative dot plot indicating proportion (%) of CD3+ T cells, PDX-derived cells, and non-virally edited CD34+ HSPCs on day 2 of co-culture. (F) Quantification of HSPCs based on absolute counts from E. (G) Representative FACS data indicating the fraction (%) of wt or ki HSPCs based on the binding to the mAb clone 6H6 at the end of the co-culture. (H) Quantification of 6H6+ cells using absolute cell numbers from G relative to the co-culture with control T cells. (A–H) Error bars: mean (SD). (A–D) Data are from one out of two independent experiments, each performed in triplicate. (E–H) Data of one experiment performed in triplicate.

