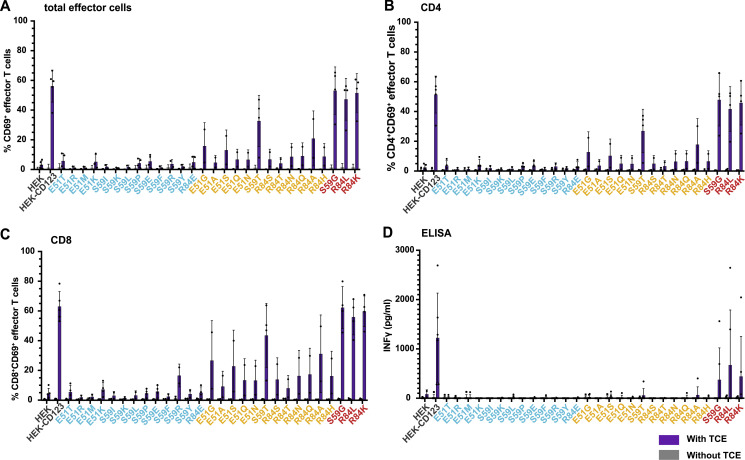
Figure S1.
TCE-mediated effector T cell activation. (A–D) 72 h co-culture of human effector T cells with HEK, HEK-CD123, and CD123 variants (effector-to-target ratio = 10:1) in the presence of the CSL362/OKT3-TCE (300 ng/ml). Percentage of CD69+ cells within total (A), gated CD4+ (B), and CD8+ (C) effector T cells with (purple) and without (gray) TCE. Data are from five independent donors and experiments with two technical replicates per group. (D) IFNγ secretion was measured by ELISA in co-culture supernatants after 72 h. (A–D) Data are from four blood donors and experiments with two technical replicates per group. Error bars: mean (SD).

