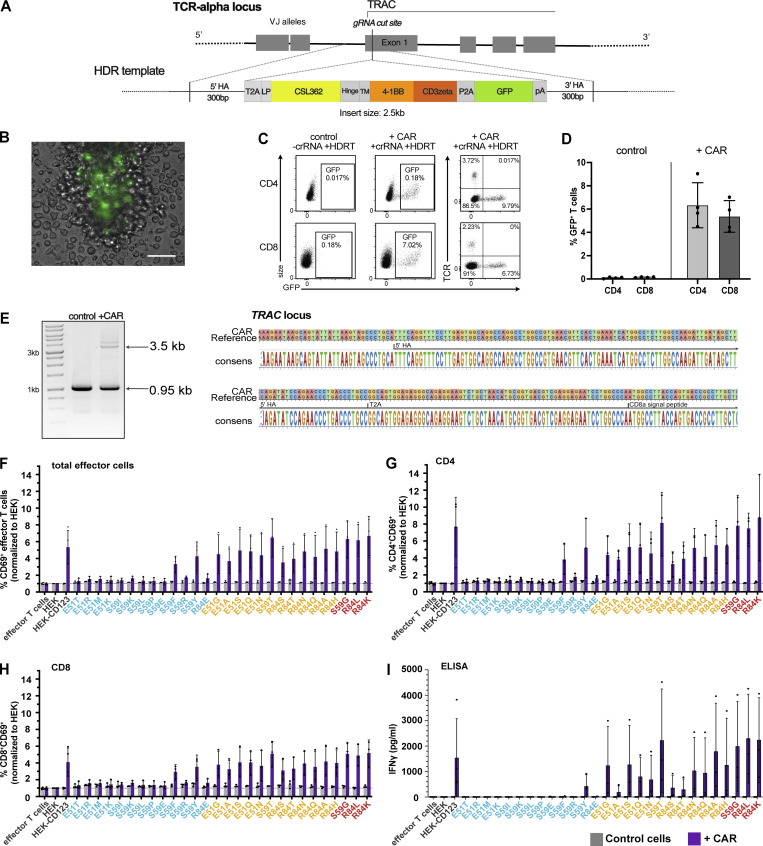
Figure S2.
123CAR design, production, and function. (A) Non-viral HDR-mediated integration of the CD123-specific second-generation CAR into Exon 1 of the TRAC locus using CRISPR/Cas9. (B) Representative microscopy image day 4 after EP showing GFP+ cells expressing the CAR-encoding template. Scale bar 100 μm. (C) Flow cytometry plots highlighting CAR insertion into the TRAC locus represented by fluorescent intensity of GFP with disrupted endogenous TCR expression in human CD4+ and CD8+ T cell subsets. (D) Mean ki efficiency of the CAR-encoding template in gated CD4+ and CD8+ T cells at day 4–5. Control indicates cells electroporated with the HDRT, but incomplete RNPs. Data are from four independent donors and experiments. (E) Sanger sequencing results (left: gel image; and right: sequencing) confirm correct HDRT integration at the TRAC locus in flow-sorted GFP+ CAR cells with primers annealing outside both arms of homology. (F–I) 123CAR T cells (purple) or control cells (gray) were co-cultured with HEK, HEK-CD123, or its variants at an effector-to-target ratio of 10:1 for 24 h. Summary of flow cytometry data indicates the percentage of CD69+ cells within total (F), gated CD4+ (G), or CD8+ (H) control (gray), or 123CAR (purple) T cells after 24 h co-culture. (I) Quantification of IFNγ in supernatants of 24 h co-cultures using ELISA. Error bars: mean (SD). Data are from three independent donors and experiments with two technical replicates per group. Source data are available for this figure: SourceData FS2.

