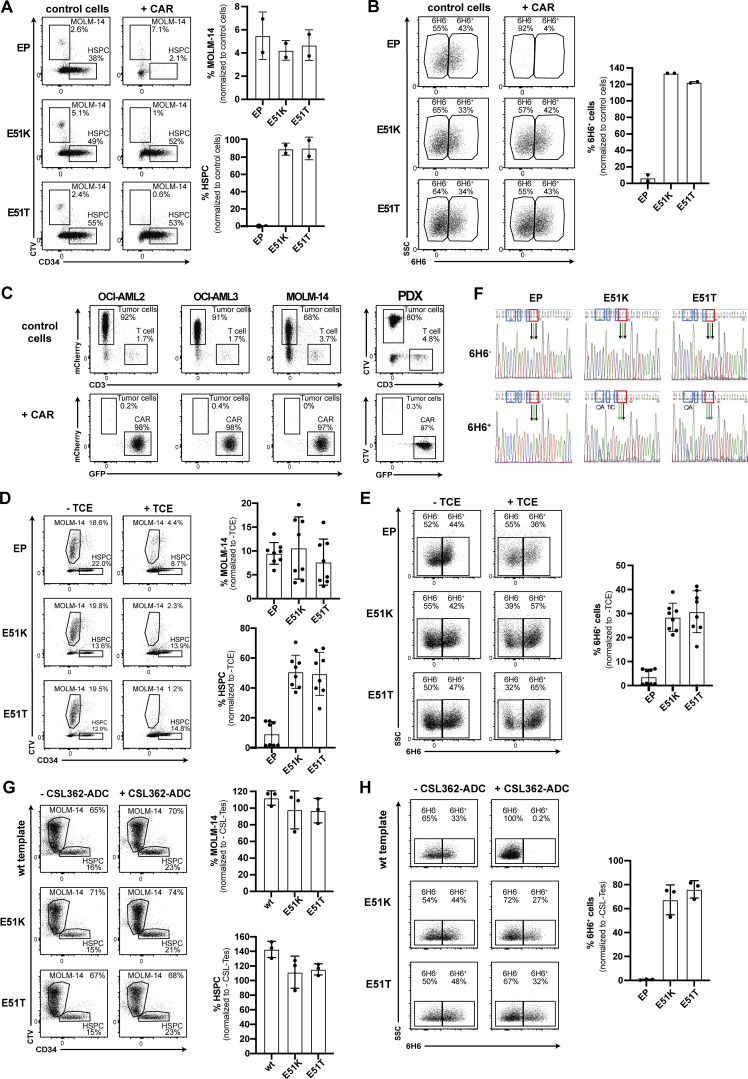
Figure S5.
Engineered HSPCs enable tumor-selective CD123 immunotherapy. (A and B) Non-virally edited HSPCs co-cultured with MOLM-14 (CTV-labeled) and control T cells or 123CAR for 3 d. EP are electroporated but non-edited HSPCs. (A) Representative dot plots indicating MOLM-14 cells and non-virally edited CD34+ HSPCs on day 3 of co-culture (left) and the proportion thereof quantified using absolute cell numbers relative to control T cells (right). (B) FACS plots illustrating wt or ki HSPCs by their binding to the mAb 6H6 at the end of the co-culture (left), and proportion of 6H6+ cells based on absolute counts. (A and B) Data of one out of two independent experiments performed in triplicate. (C) 2-d co-culture of AML cells MOLM-14-mCherry, OCI-AML2-mCherry, OCI-AML3-mCherry, and PDX (CTV-labeled) with control T cells or 123CAR. Data of one experiment performed in triplicate. (D and E) Non-virally edited HSPCs co-cultured with MOLM-14 (CTV-labeled) and autologous T cells with or without CSL362/OKT3-TCE (100 ng/ml) for 3 d. Control conditions (EP) are electroporated but non-edited HSPCs. (D) Representative dot plot (left) and proportion (right) of MOLM14 cells and CD34+ HSPCs in different conditions on day 3 of co-culture with or without TCE. Representative data are from one out of three independent experiments with two different donors performed in triplicate. (E) FACS plot (left) and percentage (right) of edited HSPCs (6H6+ cells) at the end of the co-culture with or without TCE. One of two independent experiments, each performed in triplicate, are shown. (F) Sanger sequencing chromatogram of FACS-sorted 6H6+ and 6H6− HSPCs on day 3 of co-culture with autologous T cells and CSL362/OKT3-TCE. Blue boxes: silent mutations; red boxes: E51K and E51T amino acid substitutions. Data are from one experiment. (G and H) Non-virally edited HSPCs co-cultured with MOLM-14 (CTV-labeled) with or without CSL362-ADC (10 nM) for 3 d. EP are electroporated but genetically not modified HSPCs. (G) Representative dot plot (left) and fraction (right) of MOLM14 cells and CD34+ HSPCs in different conditions on day 3 of co-culture with CSL362-ADC. Representative data are from one out of three independent experiments with two individual donors were performed in triplicate. (H) Flow cytometry data (left) and summary (right) showing the percentage of edited 6H6+ HSPCs at the end of the co-culture. Data are from one out of three individual experiments performed in triplicate. Error bars: mean (SD).

