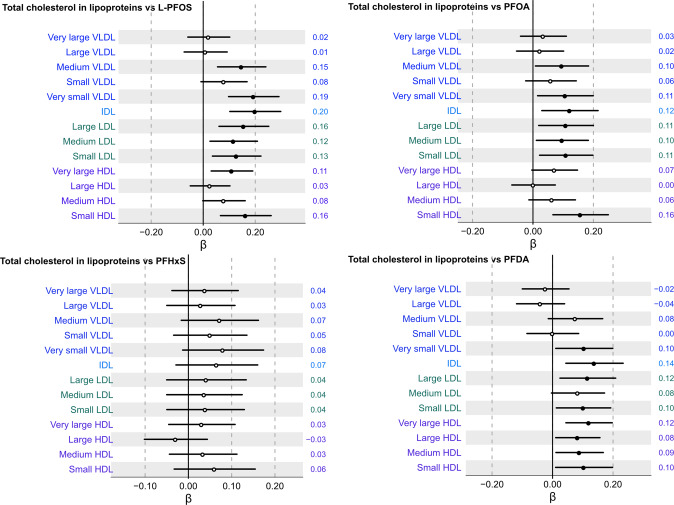
Fig. 2. Association between serum concentrations of total cholesterol across thirteen lipoprotein subfractions and L-PFOS, PFOA, PFHxS, and PFDA following multiple adjustment and multiple correction.
Beta coefficient intercepts are shown together with 95% confidence interval lines where the black dots indicate statistically significant associations (PFDR < 0.05) and white dots non-significant associations, respectively. The estimated beta-coefficients (β) are provided to the right of each row in the forest plot.

