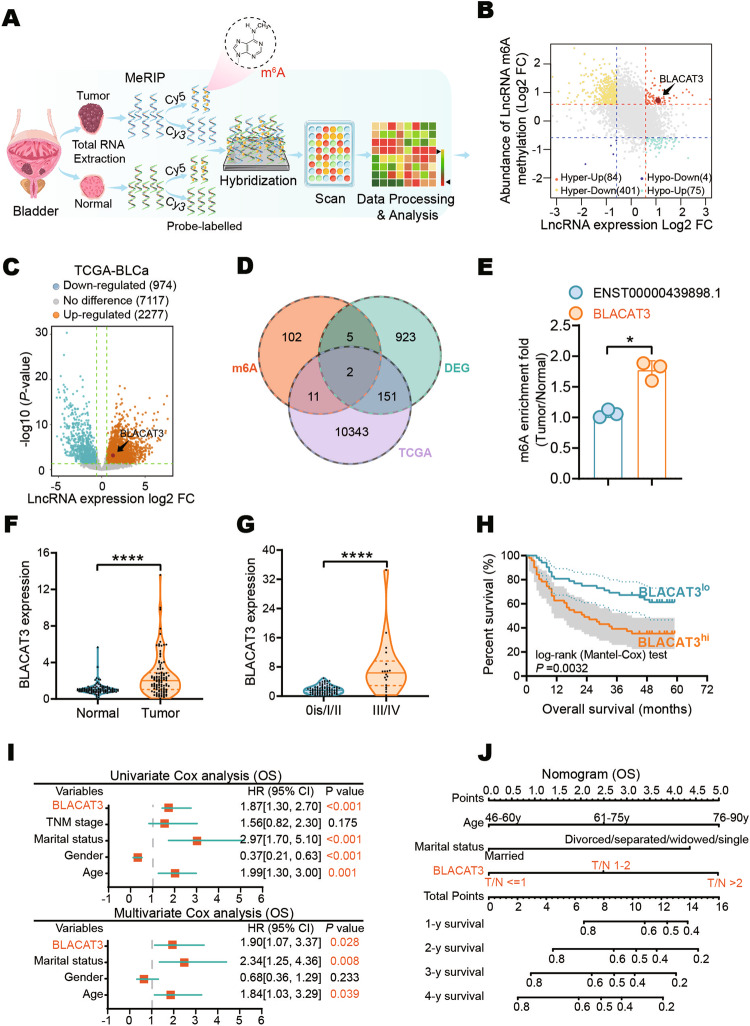
Fig. 1. BLACAT3 identification and its relationship with BLCa patient prognosis.
A Flowchart of m6A epitranscriptomic microarray. B Differentially m6A modified lncRNAs (abs(log2FC) > 0.585, P < 0.05) and differentially expressed lncRNAs ((abs(log2FC) > 0.585) between paired BLCa and adjacent normal tissues (n = 3). C Volcano plot of differential lncRNA expression profile between 411 BLCa tissues and 19 normal bladder tissues based on TCGA data (abs(log2FC) > 0.585, P < 0.05). D Venn diagrams of microarray-derived differential lncRNA m6A modification and expression profiles intersected with lncRNA expression profiles from the TCGA dataset. E MeRIP and qRT-PCR were conducted to detect m6A modification levels of BLACAT3 and ENST00000439898.1 (n = 3). F qRT-PCR was used to detect BLACAT3 expression between paired BLCa and adjacent normal tissues (n = 104). G Comparison of BLACAT3 expression between earlier stage (n = 86) and advanced stage (n = 18). H Kaplan-Meier analysis of the relationship between BLACAT3 expression and OS of BLCa patients (Log-rank (Mantel-Cox) test, P < 0.001). 104 BLCa patients were divided into high and low expression groups based on the median value of relative BLACAT3 expression. I Univariate and multivariate regression analyses were conducted to screen the independent predictors associated with OS in BLCa patients. Hazard ratio (HR) and corresponding 95% confidence intervals (CI) are shown. J Nomogram was constructed to predict the prognosis of BLCa patients undergoing RC. Statistical significance was assessed with a two-tailed Student’s t test between two groups, *P < 0.05, **** P < 0.0001.

