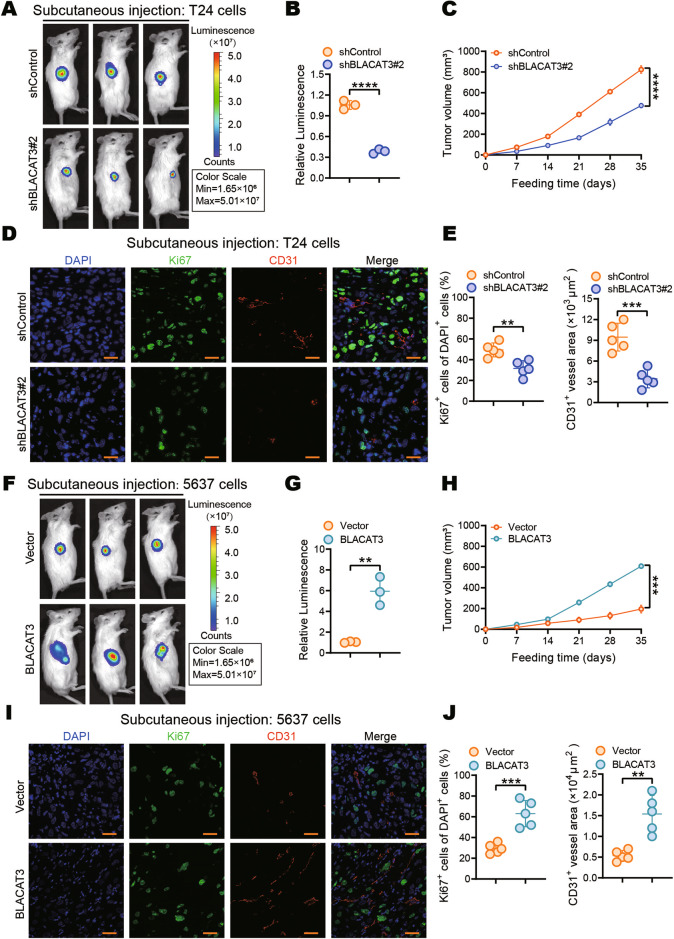
Fig. 3. Effects of BLACAT3 on BLCa proliferation in vivo.
A, B In vivo imaging was performed on day 28 after subcutaneous injection of BLACAT3 stable knockdown T24 cells into NSG mice, fluorescent quantitative statistics were performed on representative images. C Tumor volume was measured every 7 days after subcutaneous injection. D, E Anti-Ki67 and anti-CD31 IF staining was conducted to explore the effect of BLACAT3 knockdown on the proliferation and angiogenesis of T24 cells in vivo. Image J software was used for semi-quantitative analysis of representative immunofluorescent images. Scale bars: 20 μm. F, G In vivo imaging was performed on day 28 after subcutaneous injection of 5637 cells with stable BLACAT3 overexpression into NSG mice, and fluorescence quantitative statistics were performed on representative images. H Tumor volume was measured every 7 days after subcutaneous inoculation of 5637 cells. I, J Anti-Ki67 and anti-CD31 immunofluorescent staining were performed to assess the effects of BLACAT3 overexpression on the proliferation and angiogenesis of 5637 cells in vivo. Image J software was used to perform semi-quantitative analyzing of representative fluorescent images. Scale bars: 20 μm. Statistical significance was assessed using two-tailed Student’s t test between two groups, **P < 0.01, ***P < 0.001, ****P < 0.0001.

