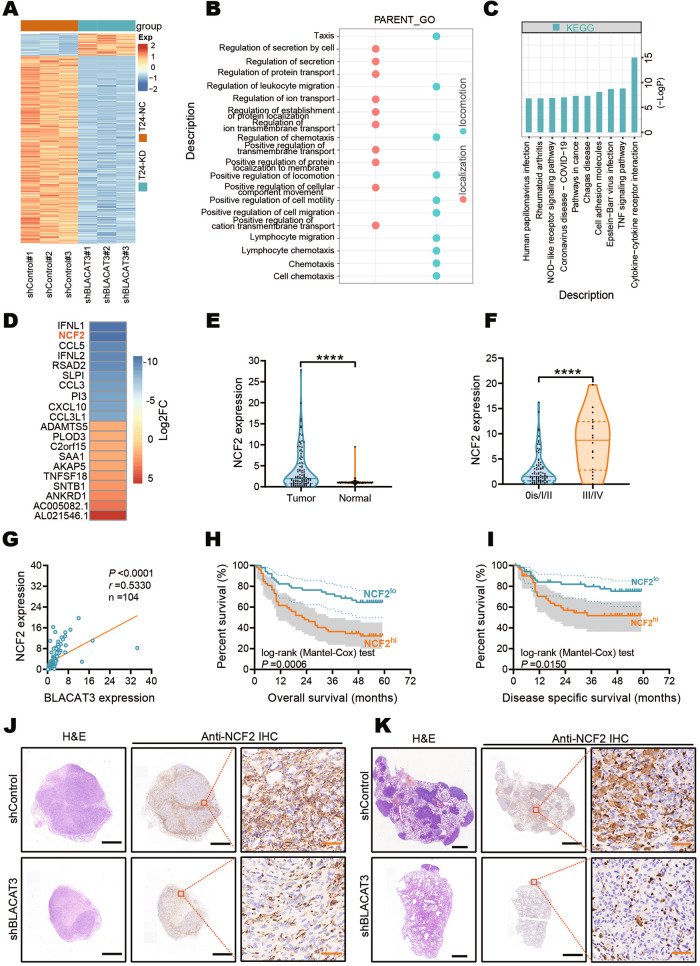
Fig. 5. NCF2 identification and its interaction with BLACAT3.
A Heatmap showed differentially expressed mRNAs in T24 cells with BLACAT3 knockdown. Abs(log2(FC)) > 0.585 and P < 0.05 were set as the thresholds. B Gene Ontology (GO) analysis showed that BLACAT3 knockdown was involved in biological functions related to movement and localization. C KEGG enrichment analysis revealed the top 10 signaling pathway regulated by BLACAT3. D Heatmap showed top10 mRNAs down- and up-regulated by BLACAT3 knockdown. E QRT-PCR detected the NCF2 expression between paired BLCa and adjacent normal tissues (n = 104). F Relative expression (Tumor/Normal ratio) of NCF2 between earlier TNM stage group (n = 86) and advanced stage group (n = 18). G Correlation analysis between BLACAT3 and NCF2 expression exhibited a positive correlation, P < 0.0001. H, I Kaplan-Meier survival curves showed the effect of NCF2 expression on the OS of BLCa patients (Log-rank (Mantel-Cox) test, P < 0.001) and DSS of BLCa patients (Log-rank (Mantel-Cox) test, P < 0.05). A total of 104 BLCa patients were divided into high expression group and low expression group by the median of relative NCF2 expression. J NSG mice were subcutaneously injected using T24 cells with BLACAT3 stable knockdown, and the mice were sacrificed on the 28th day. The subcutaneous tumor was fixed, embedded in sections, and then H&E staining and anti-NCF2 IHC staining were performed. K The mice were sacrificed on the 28th day after tail vein injection, and the gross lung samples were isolated, fixed and embedded, and then H&E staining and anti-NCF2 IHC staining were conducted. Scale bars: 1.6 mm (black lines), 40 μm (orange lines). Statistical significance was assessed using two-tailed Student’s t test between two groups, ****P < 0.0001.

