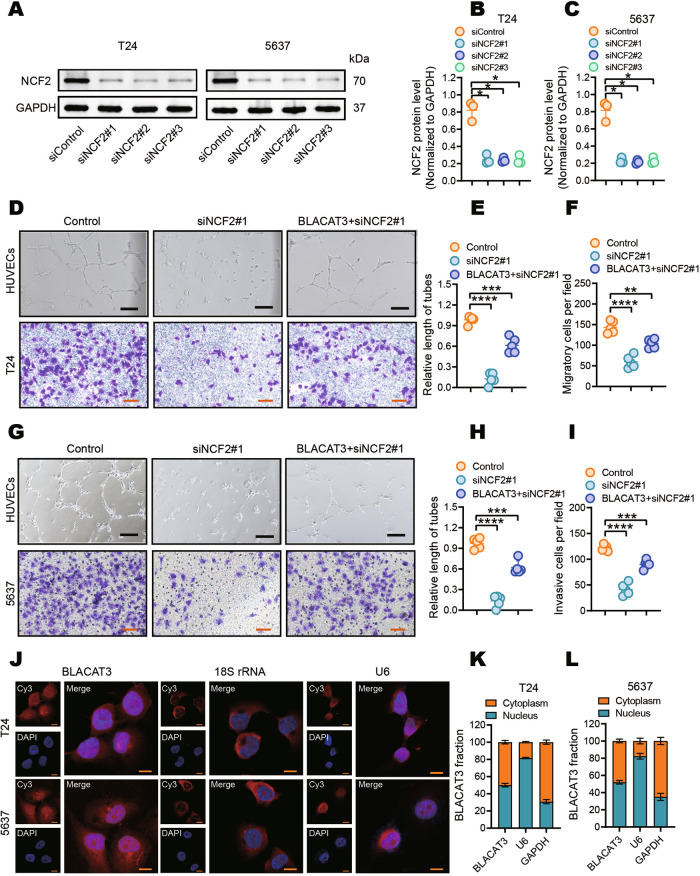
Fig. 6. Effects of NCF2 on BLCa angiogenesis and migration in vitro.
A–C WB verified NCF2 knockdown efficiency in T24 and 5637 cells. D–I HUVEC tube formation and transwell migration assays were used to investigate the effects of NCF2 knockdown on pro-angiogenesis and migratory abilities of T24 cells (D–F) and 5637 cells (G–I). Scale bars: 2 mm (black lines), 500 μm (orange lines). J Fluorescence in situ hybridization (FISH) assay detected the subcellular distribution of BLACAT3 in T24 and 5637 cells. 18 S rRNA and U6 were respectively used as cytoplasmic and nuclear internal reference biomarkers. Scale bars: 20 μm. K, L The subcellular distribution of BLACAT3 in T24 and 5637 cells was detected by qRT-PCR assay after isolation of nuclear and cytoplasmic RNAs. GAPDH and U6 were respectively used as cytoplasmic and nuclear internal reference biomarkers. Statistical significance was assessed using two-tailed Student’s t test between two groups, *P < 0.05, **P < 0.01, ***P < 0.001, ****P < 0.0001.

