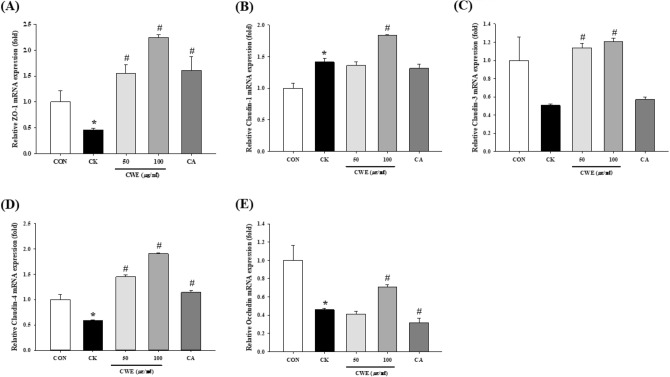
Fig. 3.
Effect of CWE on TJ mRNA expression in Caco-2 cells under inflammatory conditions. (A) ZO-1, (B) claudin-1, (C) claudin-3, (D) claudin-4, and (E) occludin expression was measured by qRT‒PCR as described in the Methods. Samples and LPS were added to the apical side, and a cytokine cocktail was then added to the basolateral side. All values are shown as the mean ± S.D. Asterisks above the bars indicate significant differences between the CON and CK groups (Student’s t test; p < 0.05). Hash marks above the bars indicate significant differences among the CK-induced groups (Dunnett’s multiple range test; p < 0.05). qRT‒PCR quantitative real-time polymerase chain reaction, CON control, CK cytokine cocktail, CWE 50 CK + 50 µg/mL CWE, CWE 100 CK + 100 µg/mL CWE, CA CK + cinnamic acid

