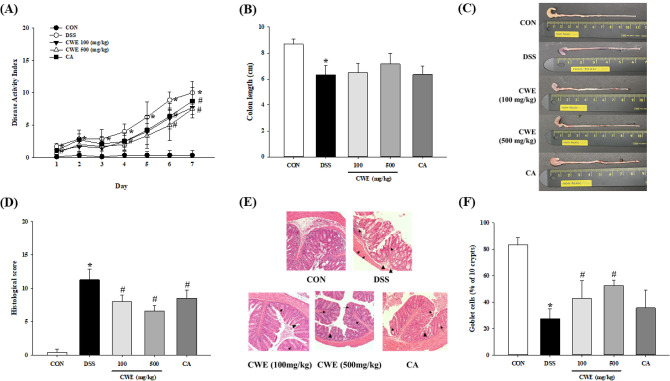
Fig. 5.
Symptoms in DSS-induced colitis mice improved after CWE treatment. (A) Disease activity index, (B) colon length, (C) representative images of the colon tissue, (D) histological scores, (E) H&E staining (× 100, demonstrates inflammation in the crypt space (arrow) and regeneration in the crypt space (arrowhead)), and (F) goblet cells (%) are shown. All values are shown as the mean ± S.D. Asterisks above the bars indicate significant differences between the CON and DSS groups (Student’s t test; p < 0.05). Hash marks above the bars indicate significant differences among the DSS-induced groups (Dunnett’s multiple range test; p < 0.05). DSS dextran sodium sulfate, CON control, DSS 5% DSS-induced colitis, CWE 100 DSS + CWE (100 mg/kg B.W.), CWE 500 DSS + CWE (500 mg/kg B.W.), CA DSS + cinnamic acid

