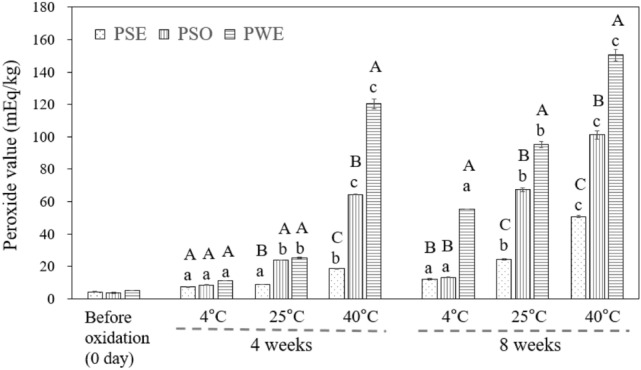
Fig. 3.

Effect of storage time and temperature on peroxide value of 3 wt% OSA-starch PSE, 3 wt% OSA-starch PWE, and PSO (n = 3). Values with A, B, C are significantly different (p < 0.05) within the same temperature and storage time. Values with a, b, and c are significantly different (p < 0.05) at only the same storage time within the same samples (PSO, PSE, and PWE), regardless of storage temperature
