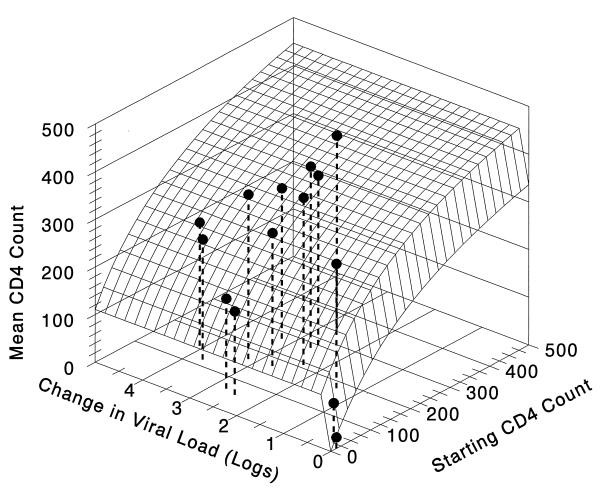
FIG. 1.
CD4 return with indinavir therapy and effect of RNA drop and starting CD4 count. The three-dimensional plot of CD4 cell return as a function of both baseline CD4 cell count and the modeled HIV RNA PCR decline induced by indinavir therapy is shown. The lines defining the edges of the surface are the direct two-dimensional relationships, with the response surface showing the interactive effect. It is clear that the amount of CD4 cell return attributable to viral load decline is maximal at very low values of HIV RNA PCR change. The equation for the surface is Average number of CD4 cells with therapy (cells/milliliter) = 110.3*{(log RNA decline)26.1/[(log RNA decline)26.1 + 0.09826.1]} + 534.6*{(starting number of CD4 cells)0.98/[(starting number of CD4 cells)0.98 + 291.30.98]}. The model fits the data quite well (r2 = 0.93, P < 0.001).

