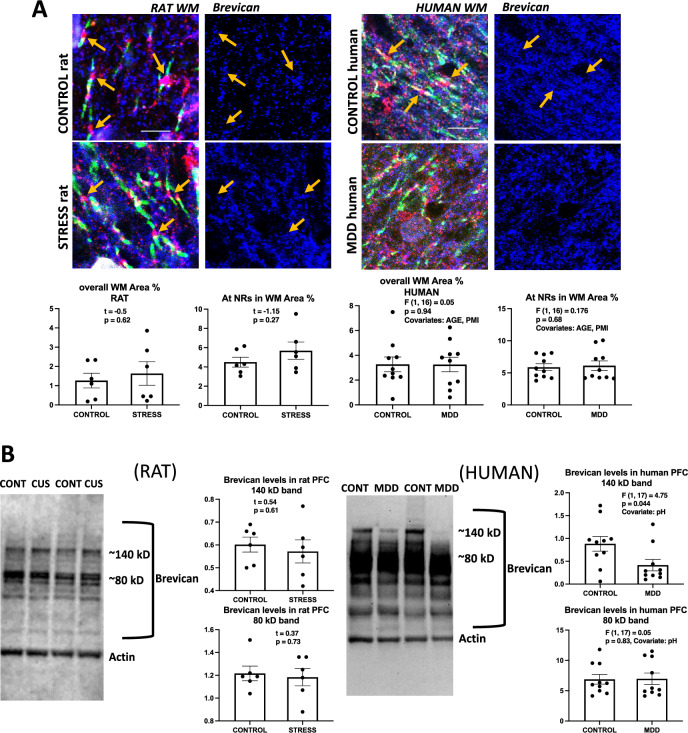
Figure 5.
Brevican labeling in histological sections and western blots of human and rat prefrontal samples. (A) Micrographs and charts illustrating the average area fraction of brevican immunoreactivity in control and CUS exposed rats (four micrographs to the left and underlying charts) and in control and MDD human subjects (four micrographs to the right and underlying charts) showing no differences in overall brevican immunoreactivity and within 8 µm2 rectangles (see legends referring to rectangles in Figs. 2 And 3) around NRs both in animals with stress and in human subjects with MDD. Arrows point to nodes of Ranvier identified in the left two pictures using triple immunofluorescent staining for CASPR (labels paranodes in green) Neurofascin (red) and Brevican (blue in all the micrographs). Calibration bar is 5 µm for rat and 8 µm for human micrographs. (B) Representative western blot lanes and quantification of optical density of Brevican bands (relative to housekeeping protein actin) in the frontal pole of control and CUS rats, and in the PFC white matter of human subjects. The pictures present bands from 2 representative rats subjected to stress as compared to 2 controls (picture to the left) and two human MDD subjects against two non-psychiatric controls (picture to the right). Quantification for bands for all subjects in each group in the study at approximately 140 and 80 kD is presented in the charts. All lanes and bands in the pictures appear as they were positioned and developed in the Western blot PVDF membrane.

