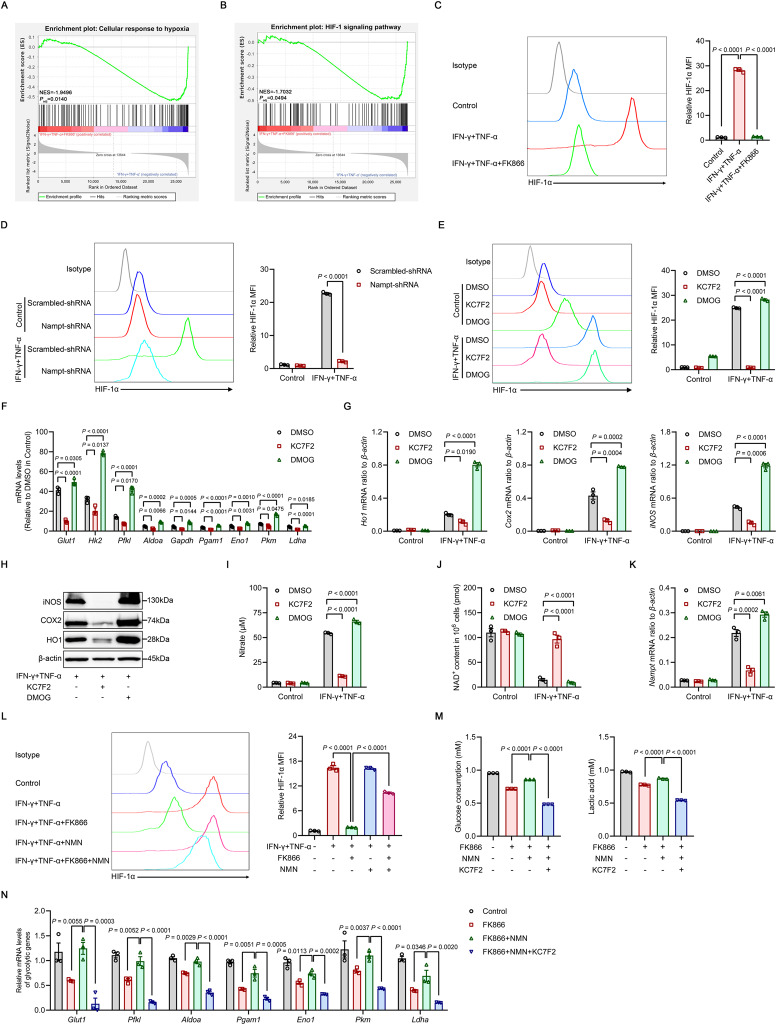
Fig. 6.
HIF-1α mediates NAD+-driven glycolysis in inflammatory cytokine-primed MSCs. A, B RNA-seq was performed on MSCs stimulated with IFN-γ and TNF-α (10 ng/ml each) for 24 h in the presence or absence of 50 nM FK866. The enrichment of genes in the cellular response to hypoxia was determined by GO enrichment analysis (A), and the HIF-1 signaling pathway was determined by KEGG enrichment analysis (B) and analyzed by GSEA. NES, normalized enrichment score; Padj, adjusted P value: two-tailed, corrected for multiple comparisons using the Benjamini‒Hochberg method (n = 3). C HIF-1α expression was examined by flow cytometry in MSCs stimulated with IFN-γ and TNF-α (10 ng/ml each) for 24 h in the presence or absence of 50 nM FK866 (n = 3). D HIF-1α expression was examined by flow cytometry in MSCs transduced with Scrambled-shRNA or Nampt-shRNA and stimulated with IFN-γ and TNF-α (10 ng/ml each) for 24 h (n = 3). E HIF-1α expression was examined by flow cytometry in MSCs stimulated with IFN-γ and TNF-α (10 ng/ml each) for 24 h in the presence of 40 μM KC7F2 or 500 μM DMOG (n = 3). F, G The expression of glycolytic and immunomodulatory factors in MSCs stimulated with IFN-γ and TNF-α (10 ng/ml each) for 24 h in the presence of 40 μM KC7F2 or 500 μM DMOG was assayed by qRT‒PCR (n = 3). H The expression of HO1, COX2, iNOS and β-actin (loading control) determined by immunoblotting in MSCs stimulated with IFN-γ and TNF-α (10 ng/ml each) for 24 h in the presence of 40 μM KC7F2 or 500 μM DMOG. I MSCs were stimulated with IFN-γ and TNF-α (10 ng/ml each) for 24 h in the presence of 40 μM KC7F2 or 500 μM DMOG, and the supernatants were assayed for nitrate by a modified Griess reagent (n = 3). J NAD+ levels in MSCs stimulated with IFN-γ and TNF-α (10 ng/ml each) for 24 h in the presence of 40 μM KC7F2 or 500 μM DMOG (n = 3). K The expression of Nampt mRNA in MSCs stimulated with IFN-γ and TNF-α (10 ng/ml each) for 24 h in the presence of 40 μM KC7F2 or 500 μM DMOG was assayed by qRT‒PCR (n = 3). L HIF-1α levels in MSCs stimulated with IFN-γ and TNF-α (10 ng/ml each) and treated with or without 50 nM FK866, 1 mM NMN or both FK866 and NMN for 24 h (n = 3). M Analysis of 24-h glucose consumption and lactate production in the supernatant of MSCs stimulated with IFN-γ and TNF-α (10 ng/ml each) with or without 50 nM FK866, 1 mM NMN or 40 μM KC7F2 for 24 h (n = 3). N The expression of glycolytic genes in MSCs stimulated with IFN-γ and TNF-α (10 ng/ml each) and the indicated combinations of 50 nM FK866, 1 mM NMN or 40 μM KC7F2 for 24 h was assayed by qRT‒PCR (n = 3). MFI, mean fluorescence intensity. Values are presented as the mean ± SEM. Statistical analysis was performed by one-way analysis of variance

