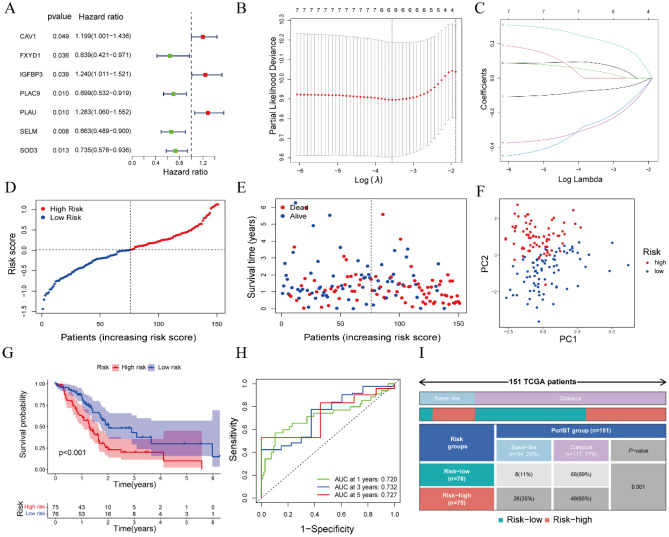
Figure 2.
Establishment of a six-gene prognostic signature based on CAF marker genes. (A) Forest map showing the seven genes with P < 0.05 obtained by univariate Cox regression analysis. (B) LASSO regression of the seven OS-related genes. (C) Tuning parameter (λ) selection cross-validation curve of these seven genes. (D) Division of PAAD patients into high-risk and low-risk groups based on median risk score. (E) Survival status of patients in the two subgroups (Blue dot: Alive, Red dot: Dead). (F) PCA plots according to risk scores in PAAD patients. (G) Kaplan–Meier analysis of OS of PAAD patients in the two subgroups. (H) ROC curve analysis of the prognostic efficiency of the risk model. (I) The relationship between CAF-associated prognostic subtypes (low-risk and high-risk group) and PDAC tumor subtypes (basal-like and classical group) in TCGA (P = 0.001).

