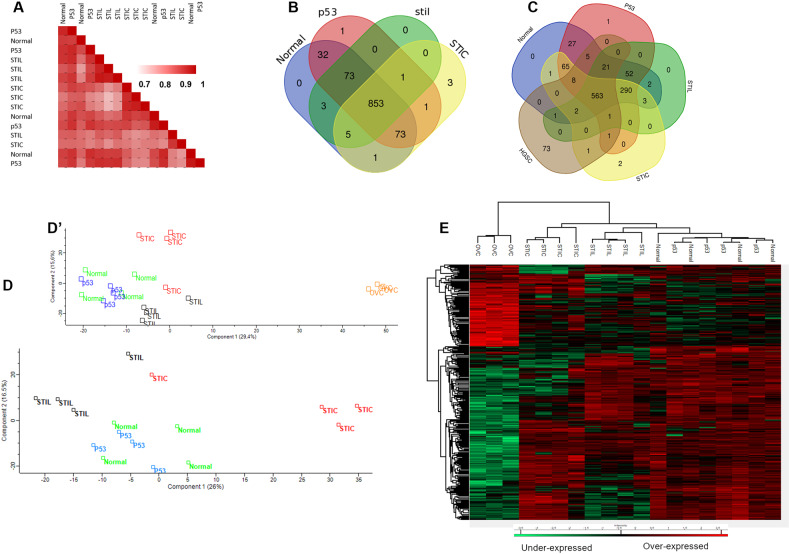
Fig. 2. Comparison of the different lesions based on their proteomic signature.
A Correlation analysis based on the whole proteome. Ven diagrams showing the distribution of identified proteins among (B) normal tissue and the different lesions and (C) with the addition of HGSC data. Principal component analysis using (D) normal tissue and the pre-neoplastic lesions and (D’) with addition to HGSC. E Hierarchical clustering of the most variable proteins (ANOVA with permutation-based FDR < 0.05) including HGSC data.

