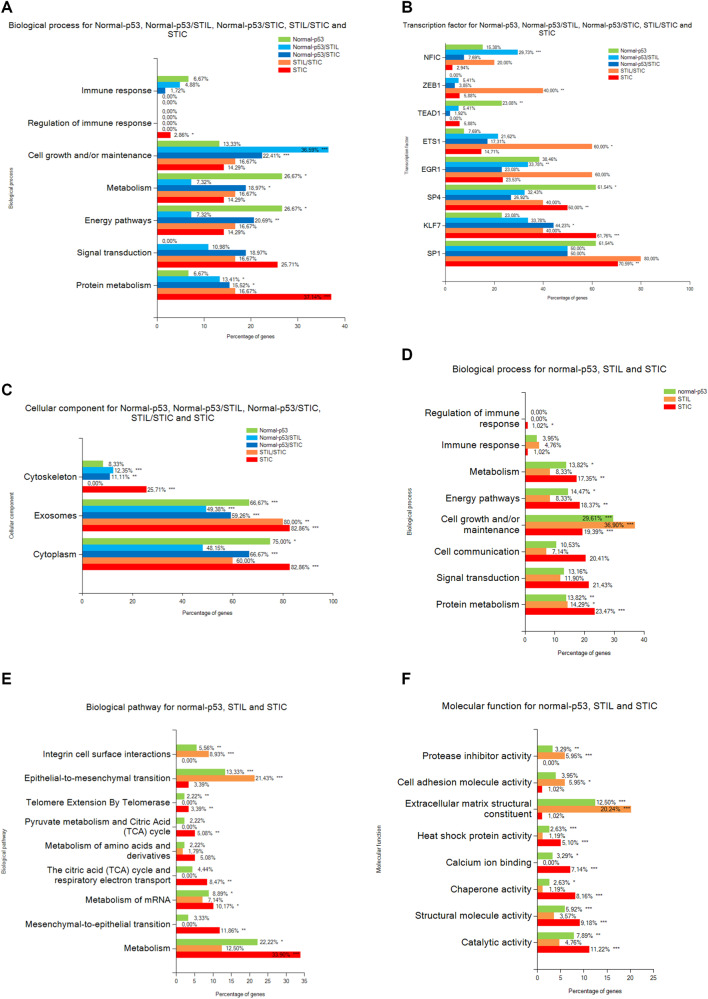
Fig. 4. Annotation analysis of gene ontology terms.
A Biological process, B Transcription factor and C Cellular component for the clusters of proteins. D Biological process, E Biological pathway and F Molecular function of the proteins overexpressed in each lesion. (hypergeometric test against all annotated gene/protein list of Funrich database, the p-value is represented by stars: ***p < 0.001, **p < 0.01, *p < 0.05 no star for p > 0.05).

