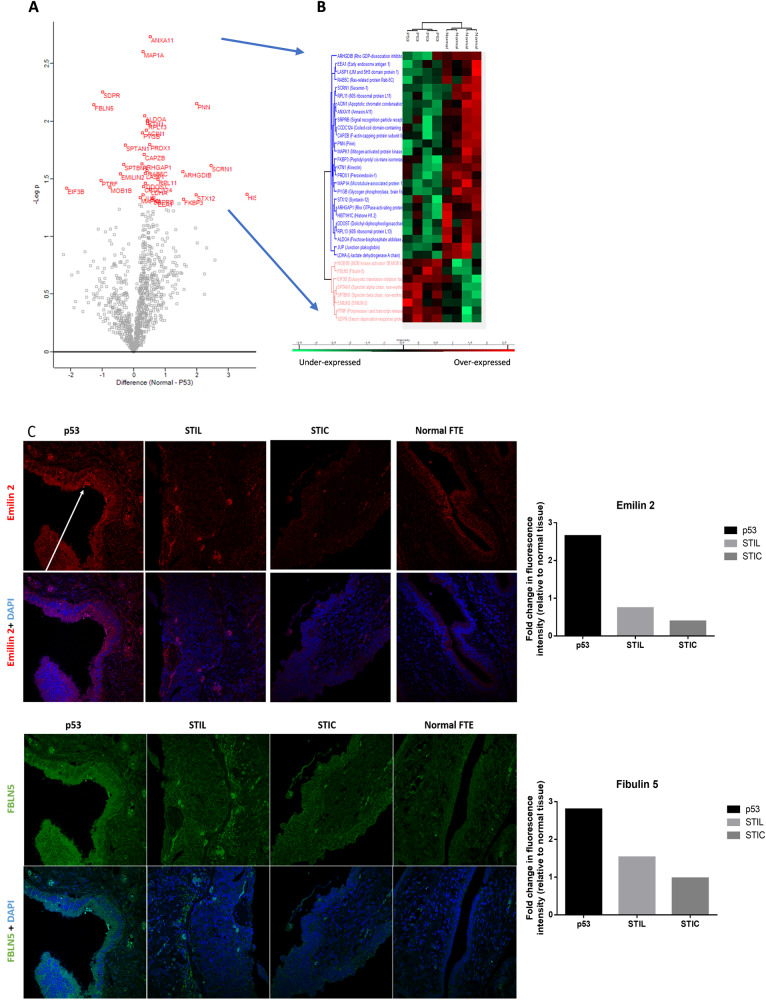
Fig. 5. Comparison between p53 signature and normal tissue.
A Visualization of a t-test in form of a volcano plot comparing normal to p53 lesion (proteins with p < 0.05 in red.) B Hierarchical clustering of the significant variable proteins between normal tissue and p53 signature (t-test with p < 0.05), C IHC of p53, STIL and STIC lesions with anti-FBLN5 and anti-Emilin2 antibodies, the arrow shows the p53 lesion on the tissue. The graphs represent the quantification of the fluorescence intensity of each marker in the corresponding tissue relative to the fluorescence intensity in the normal FTE.

