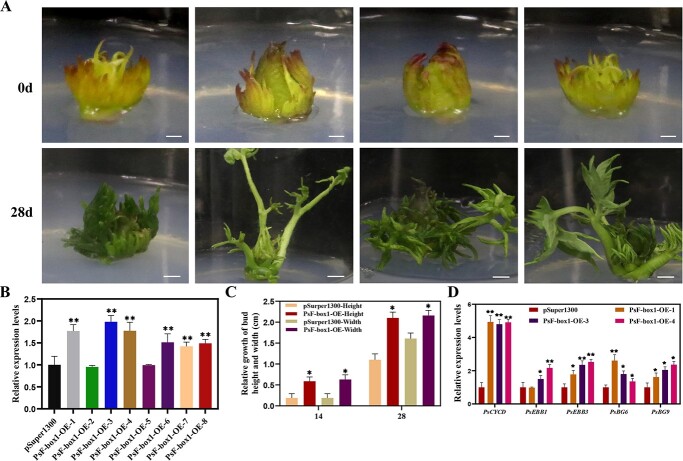
Figure 3.
Morphological changes and expression levels of genes associated with bud dormancy release in tree peony after overexpression of PsF-box1. A Morphological changes of overexpressing PsF-box1 buds after being transformed for 28 d. Scale bar, 1.0 cm. B Relative expression level of PsF-box1 by qRT-PCR after being infected for 7 d. C Relative growth in terms of the height and width of PsF-box1-OE buds after being transformed for 14 d and 28 d. The data are presented as means ± the SD of six replicates for the relative expression level. D Relative expression levels of genes including PsCYCD, PsEBB1, PsEBB3, PsBG6, and PsBG9, associated with tree peony dormancy release by qRT-PCR in PsF-box1-OE buds after being transformed for 7 d. Data represent the mean ± SD of six replicates. *P < 0.05; **P < 0.01.

