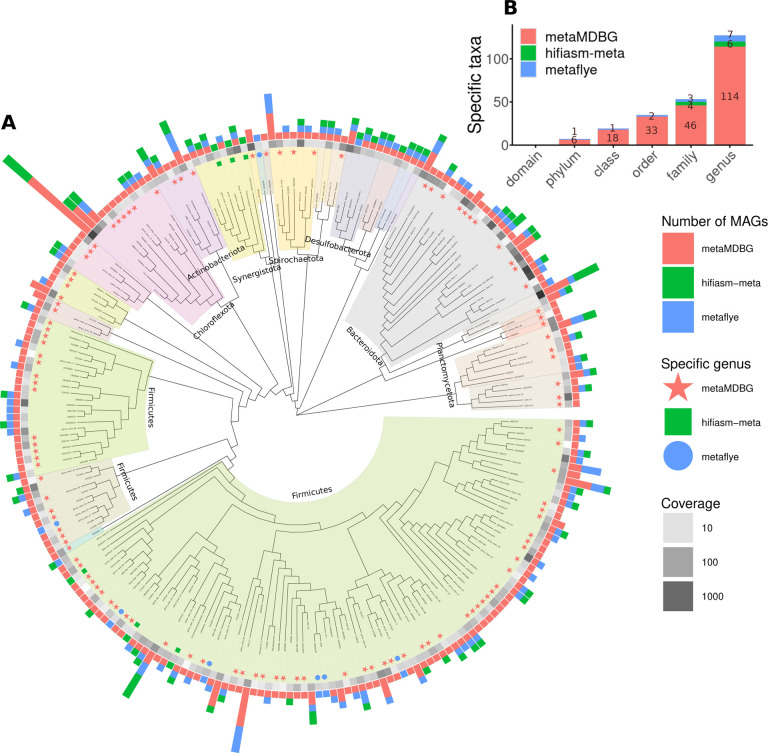
Figure 3: Phylogenetic tree of genera recovered from the AD dataset for all assemblers combined.
(A) For the near-complete bacterial MAGs, we generated a de novo phylogenetic tree based on GTDB-Tk marker genes and display at the genus level. The outer bar-charts give the number of MAGs found in each genus. The coloured symbols then denote genera recovered by only one of the assemblers. The grayscale heat-map denotes the aggregate abundance of dereplicated MAGs in a genus. (B) Number of taxa at different levels that are unique to each assembler.

