
FIGURE 2.
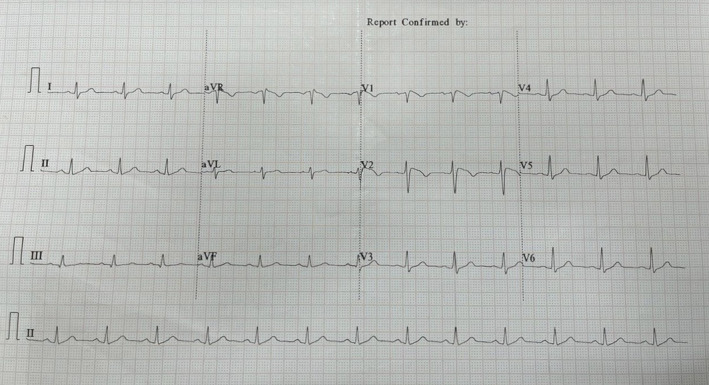
ECG taken at the time of discharge (J point elevation of 2 mm from PQ with rectilinear ST depression with T inversion, satisfying the criteria for Type 1 Brugada syndrome, similar pattern seen in aVR, sinus rhythm at 70/min, QRS axis normal, QRS narrow complex, no atrial or ventricular hypertrophy pattern, QTc interval—350 ms).