
Fig. 7.
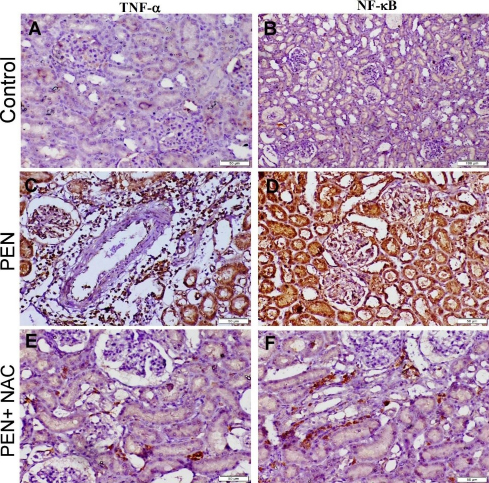
Photomicrograph of adult male albino Wistar rat kidney tissue sections stained by immunoperoxidase to localise TNF-α and NF-κB. The control group with normal TNF-α and NF-κB cytoplasmic expression (A and B), PEN group showing strong positive expression of both immune markers (C and D) and the PEN+NAC–receiving group showing weak positive expression of TNF-α and NF-κB (E and F)