Fig. 5.
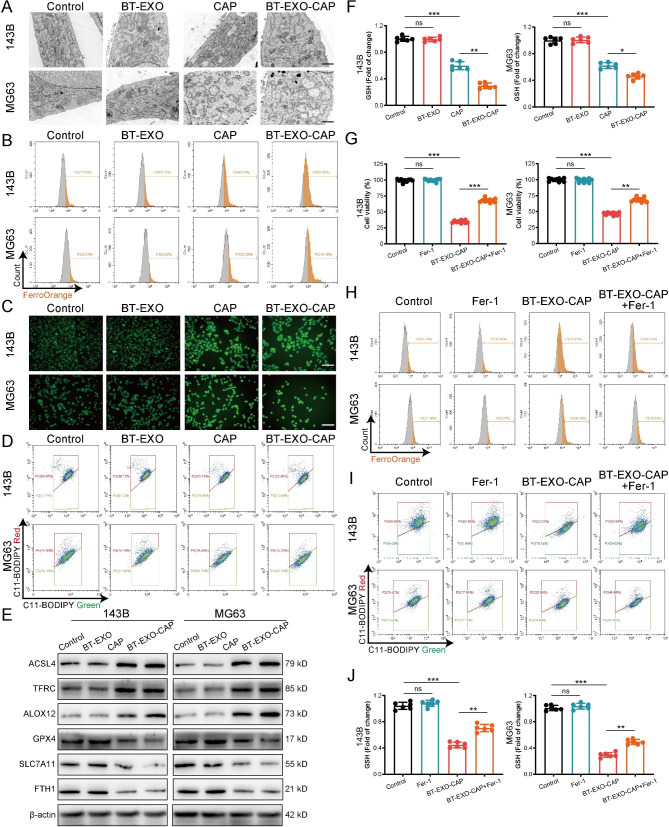
BT-EXO-CAP induced ferroptosis in human OS cells. (A) Representative TEM picture of mitochondria. (B) Flow cytometry-based detection of FerroOrange fluorescence in OS cells. (C) DCFH-DA fluorescence of OS cells captured by fluorescence microscope. (D) Flow cytometry-based detection of C11-BODIPY fluorescence in OS cells. (E) Measurement of ferroptosis-related protein expressions via WB. (F) GSH levels in OS cells. n = 6. (G) Cell viability of OS cells. n = 10. (H) Flow cytometry-based detection of FerroOrange and (I) C11-BODIPY fluorescence in OS cells. (J) GSH levels in OS cells. n = 6. * p < 0.05, ** p < 0.01, *** p < 0.001. Scale bar: A 1 μm, C 100 μm

