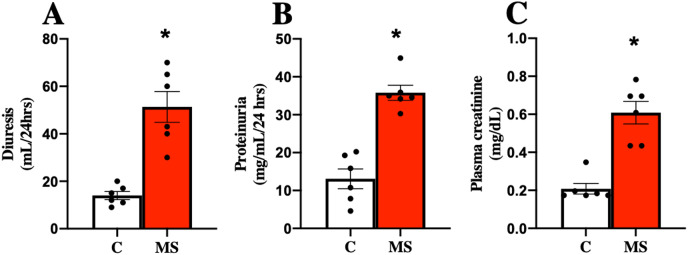
Figure 2. Kidney damage markers at 30 days.
Diuresis (A), proteinuria (B), and plasma creatinine (C), respectively. C, control; and MS, metabolic syndrome. Data are expressed as mean ± SEM, analysed by unpaired T test with Welch’s correction. Statistical significance was established as *p < 0.05 vs. C.

