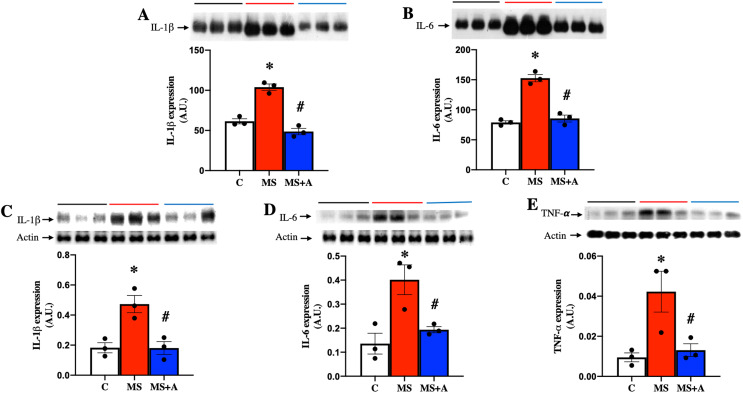
Figure 6. Effects of allicin on proinflammatory cytokines in plasma and kidney cortex at 60 days of follow-up.
Expressions of interleukin 1 beta (IL-1β) (A) and interleukin 6 (IL-6) (B) in plasma. Expression of IL-1β (C), IL-6 (D), and TNF-α (E) in kidney cortex. For representative Western blotting, three randomly selected samples per group were analysed respectively. C, control; MS, metabolic syndrome; MS+A. Data are expressed as mean ± SEM and analysed by one-way ANOVA. Statistical significance was established as *p < 0.05 vs. C; #p < 0.05 vs. MS.

