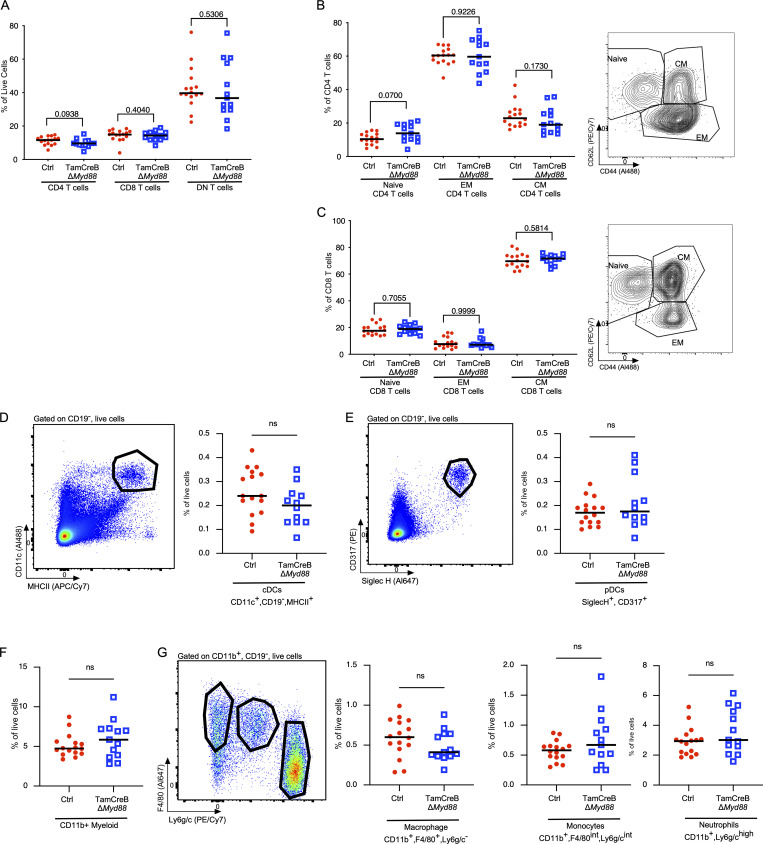
Figure S3.
Myeloid and T cell distribution and activation profile are not significantly different in mice with B cell–specific Myd88 deletion after disease onset. The T cell compartment was analyzed for 20-wk-old male Tam-hCD20-Cre;-Myd88fl MRL.Faslpr (TamCreB ΔMyd88) (n = 12–13) or Cre negative (Ctrl) (n = 16) MRL.Faslpr mice after 8 wk of tamoxifen treatment. (A–C) Distribution of TCRβ gated population, expressing CD4, CD8, or neither (DN T cells) as a percent of live cells (B) CD4 T cell distributions: naïve (CD62L+, CD44−), central memory T cells (TCM) (CD62L+, CD44+), effector memory T cells (TEM) (CD62L−, CD44+) as a % of TCRβ+CD4+ T cells, with representative FACS plot in the right panel and (C) CD8 T cells distributions: naïve (CD62L+, CD44−), TCM (CD62L+, CD44+), TEM (CD62L−, CD44+) as a % of TCRβ+CD8+ T cells with representative FACS plot in the right panel. (D) Distribution of CD11c+, MHCII+, CD19− cDCs as a percent of live cells with representative FACS plot in the left panel. (E) Distribution of CD317+, SiglecH+, CD19− pDCs as a percent of live cells with representative FACS plot in the left panel. (F) Distribution of CD11b+CD19− myeloid cells. (G) Distribution of macrophages CD11b+, F4/80+, Ly6g/c− macrophages, CD11b+, F4/80int, Ly6g/cint monocytes, and CD11b+, F4/80−, Ly6g/c+ neutrophils as a percent of live cells with representative FACS plot in the left panel. Scatter plots display data from individual mice with horizontal lines showing median values. P values as indicated, using two-tailed Mann–Whitney U test. Data shown are representative of two independent cohorts with data combined from all cohorts and n indicated for each experiment as shown.

