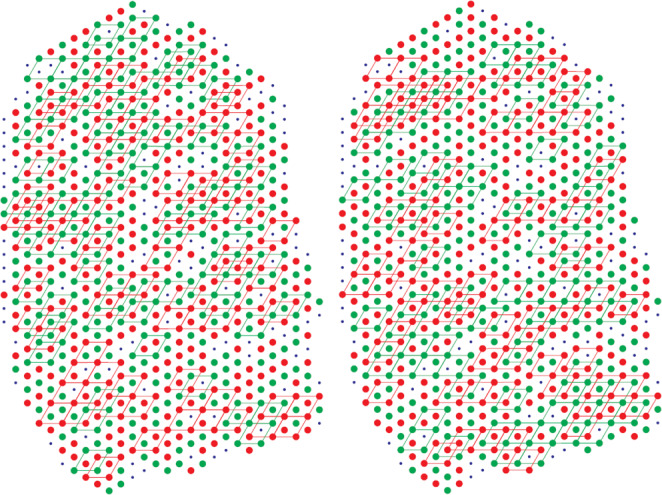
Fig. 7.

Distribution of myosin filament rotations derived from a micrograph from frog satorius muscle (left) and from a Monte Carlo simulation of the TIA (right) (Yoon 2008). The two rotations are shown by the red and green filled circles, and unknown rotations by the small blue dots. Also shown are the regions of superlattice marked by the rhombi between second-nearest-neighbour sites that all have the same rotation. The two distributions of rotations are not identical, but show similar statistical behavior
