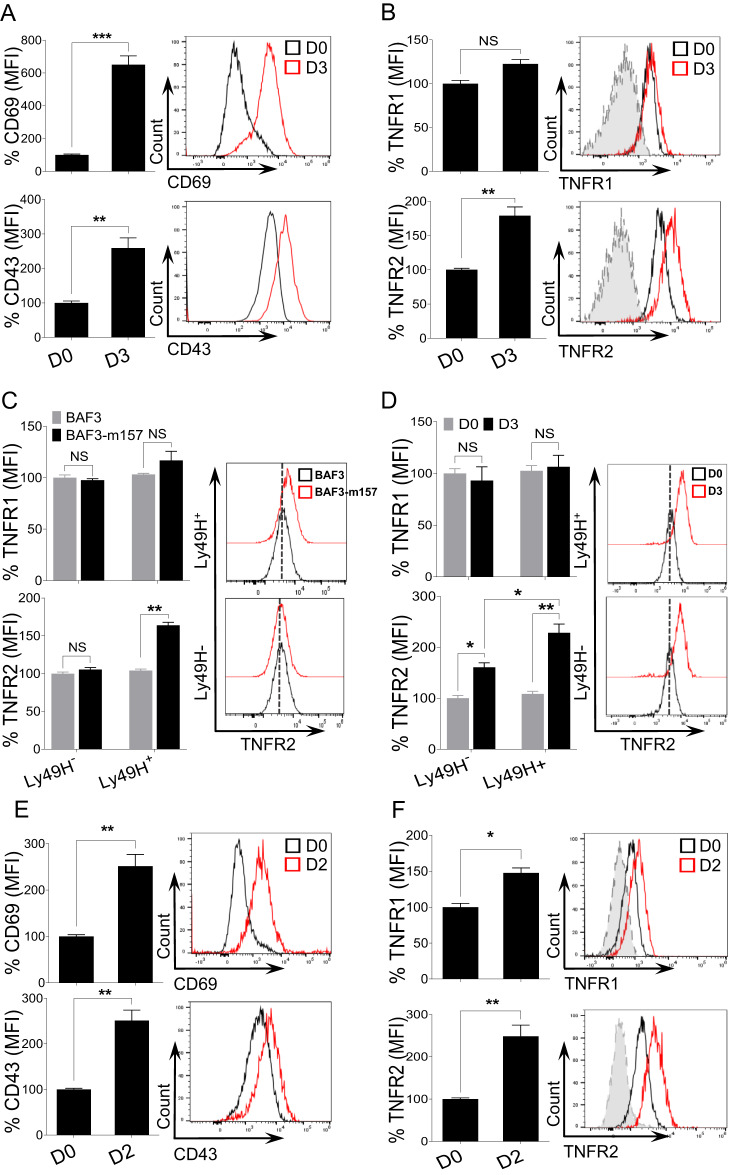
Fig. 1.
TNFR2 is highly expressed on NK cells upon MCMV- or LPS-induced inflammation. C57BL/6 mice were either left untreated or intraperitoneally infected with 3000 PFU MCMV and analyzed on the indicated days. Representative graphs describe the mean fluorescence intensity (MFI) of (A) CD69 and CD43 and (B) TNFR1 and TNFR2 expression on NK cells from the spleens of naive (D0) or MCMV-infected mice on Day 3 (D3) post-infection. C NK cells were enriched from the spleens of naive C57BL/6 mice and co-cultured with either BAF3 or BAF3-m157 cells for 18 h, and the expression of TNFR1 and TNFR2 was measured on NK cells. D C57BL/6 mice were either left untreated or infected with MCMV and analyzed on the indicated day. Representative graphs depict the MFI of TNFR1 and TNFR2 expression on NK cells from the spleen of naive (D0) or MCMV-infected mice on Day 3 (D3). C57BL/6 mice were either left untreated or intraperitoneally injected with LPS and analyzed on the indicated days. Representative graphs depict the MFI of (E) CD69 and CD43 and (F) TNFR1 and TNFR2 expression on NK cells from the spleens of naive (D0) or LPS-treated mice on Day 2 post-injection (D2). The MFI expression is presented as a percentage relative to the MFI of control mice as 100. Data are from one experiment representative of three independent experiments, with at least three mice per group. Data represent the mean ± SD. *p < 0.05; **p < 0.01; ***p < 0.001; ns nonsignificant

