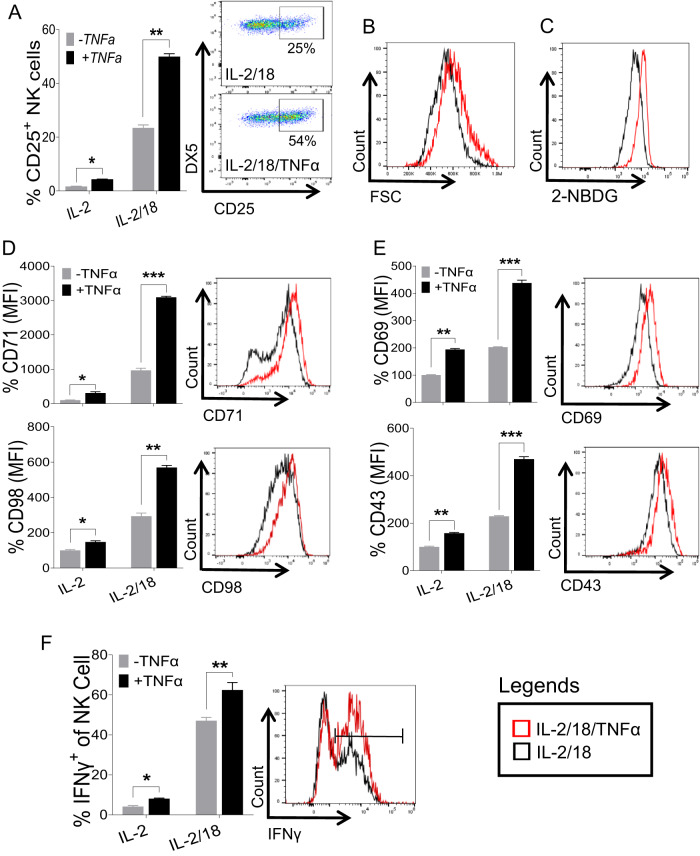
Fig. 4.
IL-18/TNFα synergistically augments NK cell activation and metabolic activity. NK cells were enriched from the spleens of naive C57BL/6 mice and stimulated with IL-18 (20 ng/ml) in the presence or absence of TNFα (30 ng/ml) ex vivo. 100 U/ml rhIL-2 was added to maintain NK cell survival. A Representative graphs depict the proportion of CD25+ cells among the total NK cell population after 24 h. B Histogram of cell size as measured by FSC, (C) glucose uptake by NK cells as measured by 2-NBDG, (D) expression of CD71 and CD98, and (E) expression of CD69 and CD43 following the stimulation of NK cells with IL-2/18 (black) and IL-2/18/TNFα (red) for 48 h are shown. F Enriched NK cells from the spleens of naive C57BL/6 mice were stimulated with IL-18 in the presence or absence of TNFα ex vivo for 24 h. 100 U/ml rhIL-2 was added to maintain NK cell survival. The graph represents the proportion of IFNγ+ cells among the total NK cell population. The MFI expression is presented as a percentage relative to the MFI of control cells as 100. Data are from one experiment representative of three independent experiments, with at least two replicates per group. Data represent the mean ± SD. *p < 0.05; **p < 0.01; ***p < 0.001

