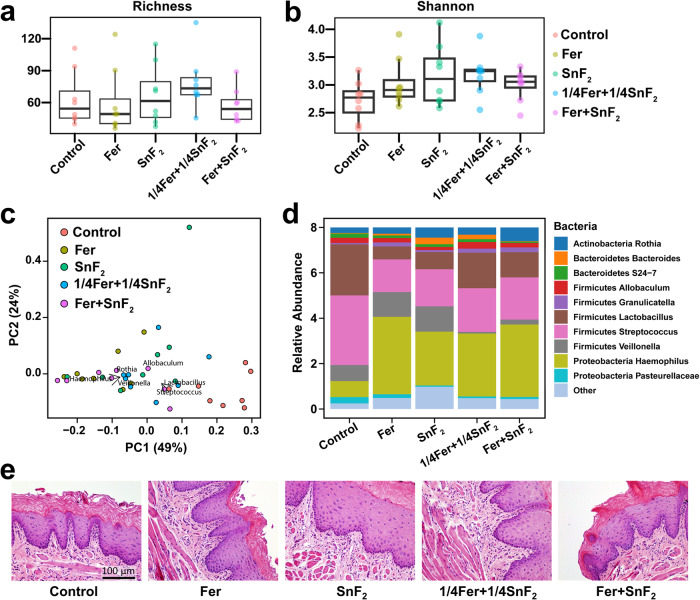
Fig. 6. Effects of Fer and SnF2 on oral microbiome and gingival tissue in vivo post-treatment.
a, b Alpha diversity measured by Richness and Shannon indexes shows no significant differences between groups. The lines on the boxplots represent the lower and upper quartiles, while the center line indicates the median (n = 8, for each treatment group). c Principal coordinate analysis (PCoA) using weighted UniFrac distances reveal that the Fer + SnF2 group has a similar composition and the lowest distances between samples. d The bar plot shows the main bacterial genera found across all samples, distributed by treatment groups (n = 8, for each treatment group). e Histology of the gingival tissue with treatments noted. Fer, 1/4Fer, SnF2, and 1/4SnF2 indicate 1 mg of Fe/ml, 0.25 mg of Fe/ml, 250 ppm of F, and 62.5 ppm of F, respectively.

