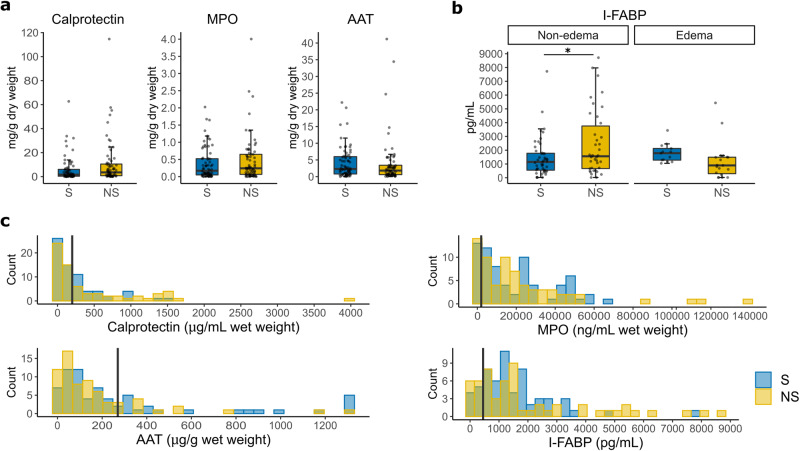
Fig. 3. Enteropathy marker levels at admission between survivors and nonsurvivors.
a Concentrations of fecal enteropathy markers in dry fecal weight between nonsurvivors (NS) and survivors (S): Calprotectin (P = 0.08), Myeloperoxidase (MPO, P = 0.27), Alpha-1 antitrypsin (AAT, P = 0.54). (b) Serum marker Intestinal fatty acid binding protein (I-FABP) concentrations stratified by edema status between NS and S (n = 57 cases and 61 controls with one outlier in controls removed; Pnon-edema = 0.029, Pedema = 0.91, Pinteraction = 0.082). c Histograms showing distribution of individual enteropathy marker between NS and S. Concentrations are expressed in wet fecal weight. Vertical line indicates clinical cutoffs for normal marker levels in non-tropical settings (calprotectin: 200 μg/g wet feces, MPO: 2000 ng/ml wet feces, AAT: 270 ug/g wet feces, I-FABP: 450 pg/ml), marker levels above these cutoffs are considered elevated28–30. Unless stated otherwise, n = 68 cases and 68 controls. Each boxplot shows the median (center line), IQR (box limits), and data points with whiskers showing 1.5 times IQR. * P < 0.05.

