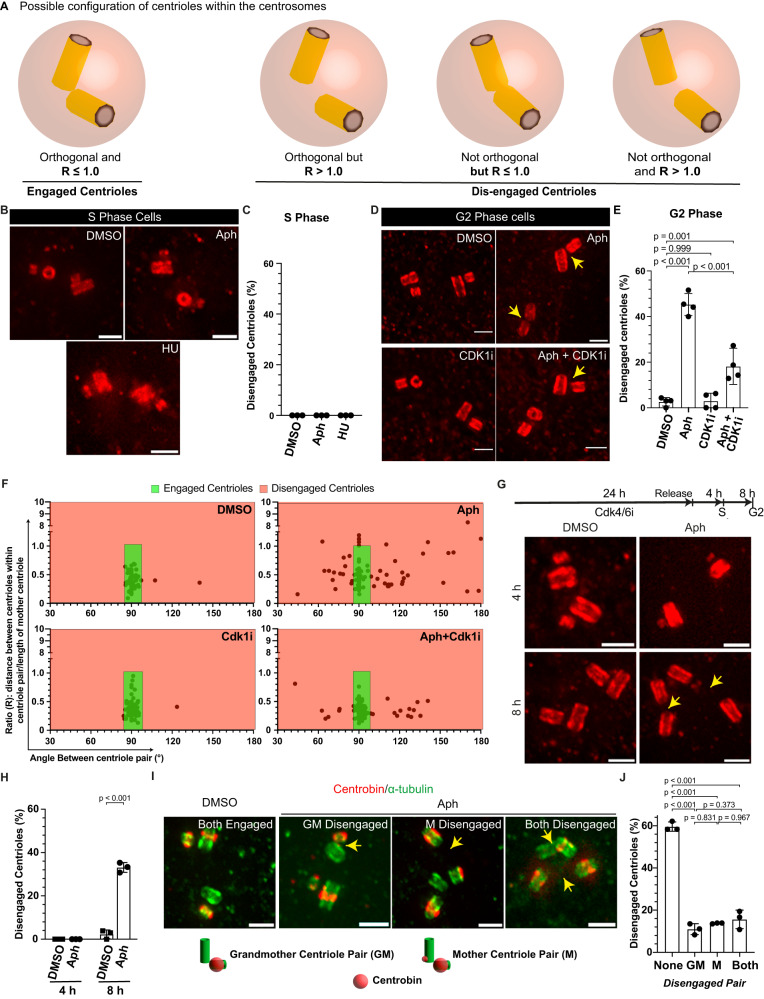
Fig. 1. Mild replication stress causes premature centriole disengagement in the G2 phase.
A Possible centriole configurations in G2 centrosomes to identify centrosomes with disengaged centrioles. B U-ExM images of centrioles in S phase RPE1 cells stained against α-tubulin and treated with indicated drugs. C Quantification of the percentage of S-phase cells with disengaged centrioles in their centrosomes (N = 3 independent experiments, n = 86, 79 and 81 cells for DMSO, Aph and HU, respectively). D U-ExM images of centrioles in G2 phase RPE1 cells stained against and α-tubulin treated with indicated drugs/inhibitors. E Quantification of the percentage of G2 phase cells with disengaged centrioles in their centrosomes. Each dot in the plot represents one centriole pair (N = 4 independent experiments, n = 111, 128, 101 and 111 cells in DMSO, Aph, Cdk1i and Aph+Cdk1i, respectively: p-values from two-tailed Sídak test). F Dot plot showing the distribution of centriole orientation with respect to the ratio of centriole distance to mother centriole length. Each dot in the plot represents one centriole pair (N = 4 independent experiments, n = 111, 128, 101 and 111 cells in DMSO, Aph, Cdk1i and Aph+Cdk1i, respectively). G U-ExM images of centrioles in RPE1 cells at the indicated time after release from G1 arrest and stained against α-tubulin and treated with indicated drugs. H Quantification of the percentage of cells with disengaged centrioles at the indicated time after Cdk4/6i release (N = 3 independent experiments, n = 4 h DMSO: 95, 8 h DMSO: 86, 4 h Aph: 103 and 8 h Aph: 87 cells: p-values from two-tailed Sídak test.) I U-ExM images of centrioles in G2 phase RPE1 cells stained against α-tubulin (green) and Centrobin (red) and treated with indicated drugs. J Quantification of the percentage of cells with disengaged centrioles in their old and new centrosomes (N = 3 independent experiments, n = 85 and 109 cells in DMSO and Aph, respectively; p-values from two-tailed Sídak test). The cells in Aph were further categorised based on the age of the disengaged centriole pair, as indicated. The yellow arrowheads in respective U-ExM images indicate a disengaged centriole pair. Data presented as mean ± SD. Scale bars = 0.5 µm. Source data for all graphs are provided as a Source Data file.

