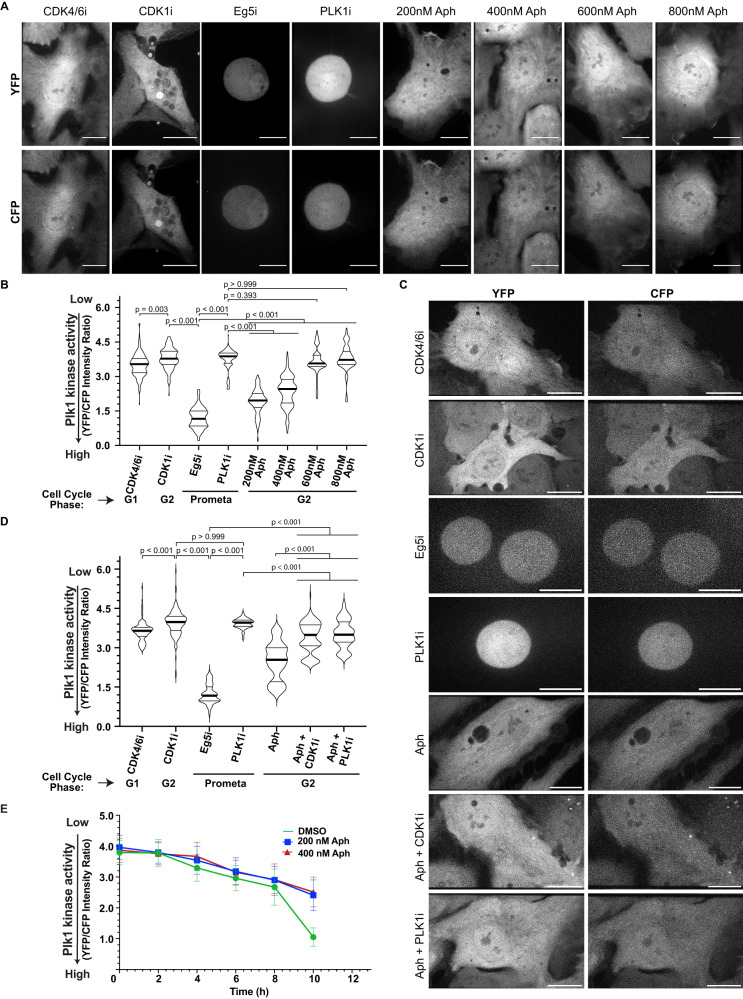
Fig. 5. Mild replication stress delays full Plk1 activation resulting in its sub-critical activity.
A Representative images of CFP and YFP fluorescence from RPE1 Plk1-FRET Sensor cells treated with indicated inhibitors/drugs. B Violin plots of YFP/CFP intensity ratios from cells in (A) [N = 3 independent experiments, n = 162 (Cdk4/6i), 164 (Cdk1i), 157 (Eg5i), 164 (Plk1i), 161 (200 nM Aph), 167 (400 nM Aph), 134 (600 nM Aph) and 132 (800 nM Aph) cells: p-values from Dunn’s multiple comparison test]. C Representative images of CFP and YFP fluorescence from RPE1 Plk1-FRET Sensor cells treated with indicated inhibitors/drugs. D Violin plots of YFP/CFP intensity ratios from cells in C [N = 3 independent experiments, n = 149 (Cdk4/6i), 149 (Cdk1i), 142 (Eg5i), 154 (Plk1i), 148 (Aph), 135 (Aph+Cdk1i) and 143 (Aph+Plk1i); p = Dunn’s multiple comparison test]. Median in each case is marked with a bold black line and thin grey lines denote the 1st and 3rd quartiles. E Quantification of dynamics of Plk1 activity in RPE1 cells as they progress through S and G2 phase after treatment with indicated drugs. Data plotted as mean ± SD (N = 4 independent experiments, n = 210 (0 h: DMSO), 198 (2 h: DMSO), 202 (4 h: DMSO), 183 (6 h: DMSO), 194 (8 h: DMSO), 177 (10 h: DMSO), 204 (0 h: 200 nM Aph), 199 (2 h: 200 nM Aph), 197 (4 h: 200 nM Aph), 191 (6 h: 200 nM Aph), 212 (8 h: 200 nM Aph), 200 (10 h: 200 nM Aph), 209 (0 h: 400 nM Aph), 197 (2 h: 400 nM Aph), 200 (4 h: 400 nM Aph), 185 (6 h: 400 nM Aph), 210 (8 h: 400 nM Aph) and 182 (10 h: 400 nM Aph); (p-values from two-tailed Sídak test)). Scale bars = 0.5 µm. Source data for all graphs are provided as a Source Data file.

