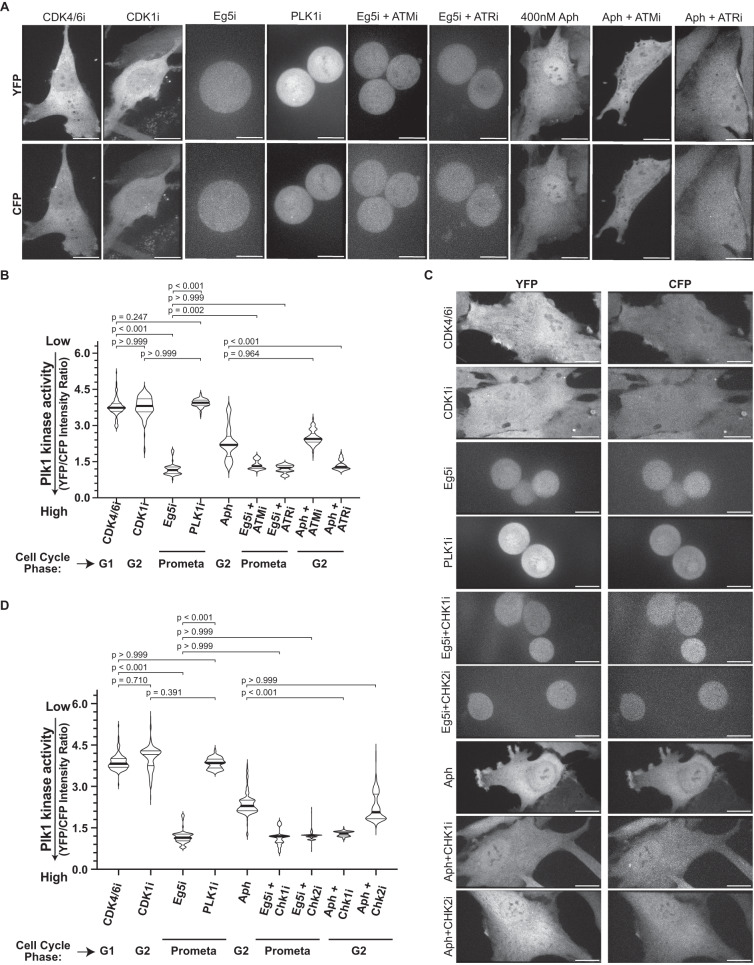
Fig. 6. ATR/Chk1 axis regulates the sub-critical Plk1 activity during replication stress.
A Representative images of CFP and YFP fluorescence from RPE1 Plk1-FRET Sensor cells treated with indicated inhibitors/drugs targeting indicated actors of the DNA damage repair pathway. B Violin plots of YFP/CFP intensity ratios from cells in A [N = 3 independent experiments, n = 146 (Cdk4/6i), 146 (Cdk1i), 146 (Eg5i), 151 (Plk1i), 149 (Aph), 151 (Eg5i+ATMi), 156 (Eg5i+ATRi), 159 (Aph+ATMi) and 159 (Aph+ATRi); p-values from Dunn’s multiple comparison test]. C Representative images of CFP and YFP fluorescence from RPE1 Plk1-FRET Sensor cells treated with indicated inhibitors/drugs against DNA repair pathway proteins. D Violin plots of YFP/CFP intensity ratios from cells in C [N = 3 independent experiments, n = 152 (Cdk4/6i), 173 (Cdk1i), 178 (Eg5i), 175 (Plk1i), 176 (Aph), 180 (Eg5i+Chk1i), 181 (Eg5i+Chk2i), 176 (Aph+Chk1i) and 185 (Aph+Chk2i): p-values from Dunn’s multiple comparison test]. Median in each case is marked with a bold black line and thin grey lines denote the 1st and 3rd quartiles. Scale bars = 0.5 µm. Source data for all graphs are provided as a Source Data file.

