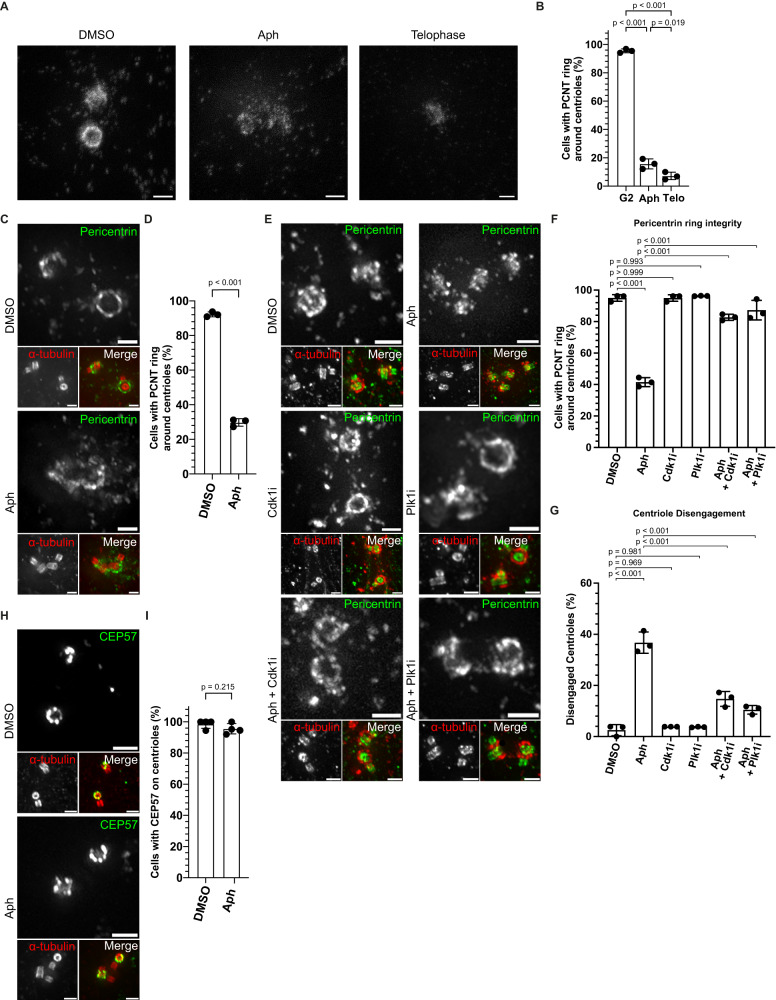
Fig. 7. Mild replication stress affects PCM integrity.
A STED nanoscopy images of zoomed pericentriolar region of G2 phase RPE1 cells treated either with DMSO or Aph and DMSO-treated cells in telophase. B Quantification for the percentage of G2 cells having intact pericentrin as ring in conditions depicted in (A) (N = 3 independent experiments, n = 71, 78 and 70 for DMSO: G2 phase, Aph and DMSO: Telophase cells, respectively: p-values from two-tailed Sídak test). C U-ExM images of centrioles in G2 Phase RPE1 cells treated either with DMSO or Aph and stained for α-tubulin (red) and Pericentrin (green). D Quantification of the percentage of G2 phase cells with complete Pericentrin ring around centrioles depicted in C (N = 4 independent experiments, n = 82 and 76 cells in DMSO and Aph, respectively: p-values from two-tailed t-test). E U-ExM images of centrioles in G2 Phase hTERT-RPE1 cells treated either with indicated drugs and stained for α-tubulin (red) and Pericentrin (green). F Quantification of G2 phase cells with complete Pericentrin ring around centrioles depicted in E (N = 3 independent experiments, n = 80: DMSO, 87: Aph, 78: RO3306, 81: BI2536, 81: Aph+RO3306 and 96: Aph+BI2536: p-values from two-tailed Sídak test). G Quantification of G2 phase cells with disengaged centrioles (N = 3 independent experiments, n = 80: DMSO, 87: Aph, 78: RO3306, 81: BI2536, 81: Aph+RO3306 and 96: Aph+BI2536: p-values from two-tailed Sídak test). H U-ExM images of centrioles in G2 Phase RPE1 cells treated either with indicated drugs and stained for α-tubulin (red) and CEP57 (green). I Quantification of the percentage of G2 phase cells with complete CEP57 ring around their centrioles (N = 4 independent experiments, n = 65 and 83 cells in DMSO and Aph, respectively: p-values from two-tailed t-test). Data presented as mean values ± SD. Scale bars = 0.5 µm. Source data for all graphs are provided as a Source Data file.

