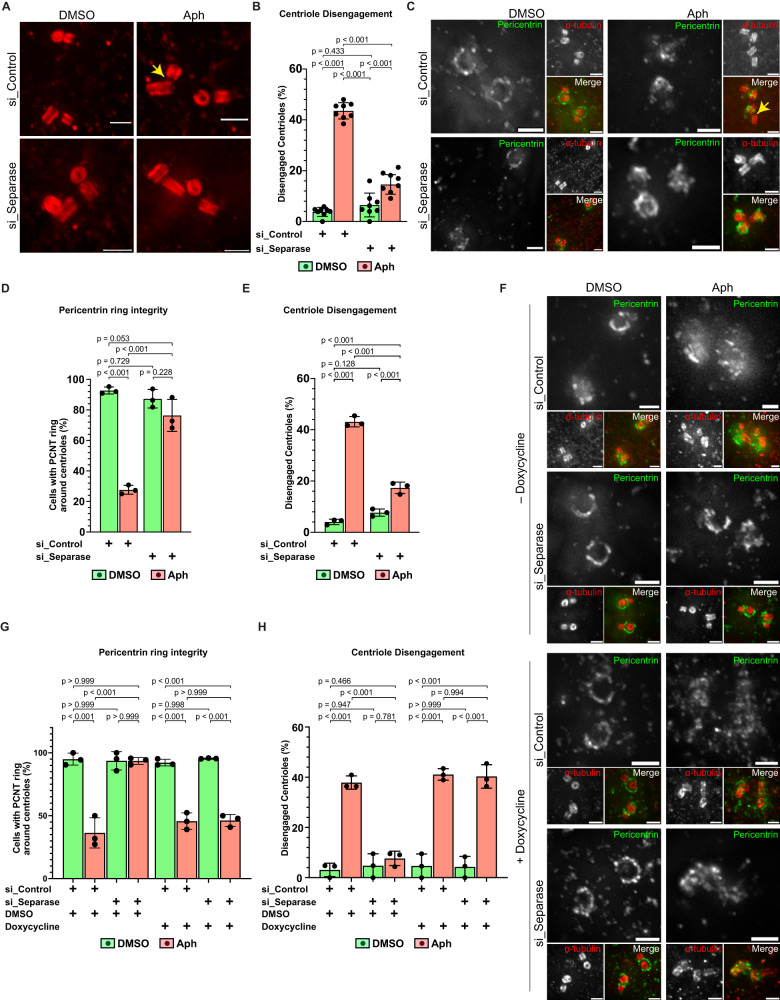
Fig. 8. Premature centriole disengagement requires Separase-dependent PCM disintegration.
A U-ExM images of centrioles in G2 phase RPE1 cells treated either with siControl or siSeparase and DMSO or Aph. B Quantification of G2 phase cells having engaged centrioles depicted in (A) (N = 8 independent experiments, n = 187, 195, 188 and 192 cells in siControl:DMSO, siControl:Aph, siSeparase:DMSO and siSeparase:Aph, respectively: p-values of two-tailed Sídak test). C U-ExM images of centrioles in G2 phase RPE1 cells treated either with DMSO or Aph and siControl or siSeparase and stained with α-tubulin (red) and Pericentrin (PCM: green). D Quantification of G2 phase cells with complete Pericentrin ring around their centrioles depicted in C (N = 3 independent experiments, n = 68, 70, 60 and 61 cells treated with siControl:DMSO, siControl:Aph, siSeparase:DMSO and siSeparase:Aph, respectively: p-values from two-tailed Sídak test). E Quantification of G2 phase cells with disengaged centrioles depicted in C (N = 3 independent experiments, n = 68, 70, 60 and 61 cells treated with siControl:DMSO, siControl:Aph, siSeparase:DMSO and siSeparase:Aph, respectively; p-values from two-tailed Sídak test). F U-ExM images of centrioles in G2 phase RPE1:Myc-Separase cells treated with indicated inhibitors/drugs along with either siControl or siSeparase and stained with α-tubulin (red) and Pericentrin (green). G Quantification of G2 phase cells with complete Pericentrin ring around centrioles depicted in F (N = 3 independent experiments, n = [64: si_Control+DMSO, 66: si_Control+Aph, 64: si_Separase+DMSO, 66: si_Separase+Aph] and [64: si_Control+DMSO, 66: si_Control+Aph, 67: si_Separase+DMSO, 67: si_Separase+Aph: p-values from two-tailed Sídak test] in absence or presence of doxycycline, respectively). H Quantification of G2 phase cells with disengaged centrioles depicted in F (N = 3 independent experiments, n = [64: si_Control+DMSO, 66: si_Control+Aph, 64: si_Separase+DMSO, 66: si_Separase+Aph] and [64: si_Control+DMSO, 66: si_Control+Aph, 67: si_Separase+DMSO, 67: si_Separase+Aph] in absence or presence of doxycycline, respectively: p-values from two-tailed Sídak test). Data presented as mean values ± SD. Scale bars = 0.5 µm. Source data for all graphs are provided as a Source Data file.

