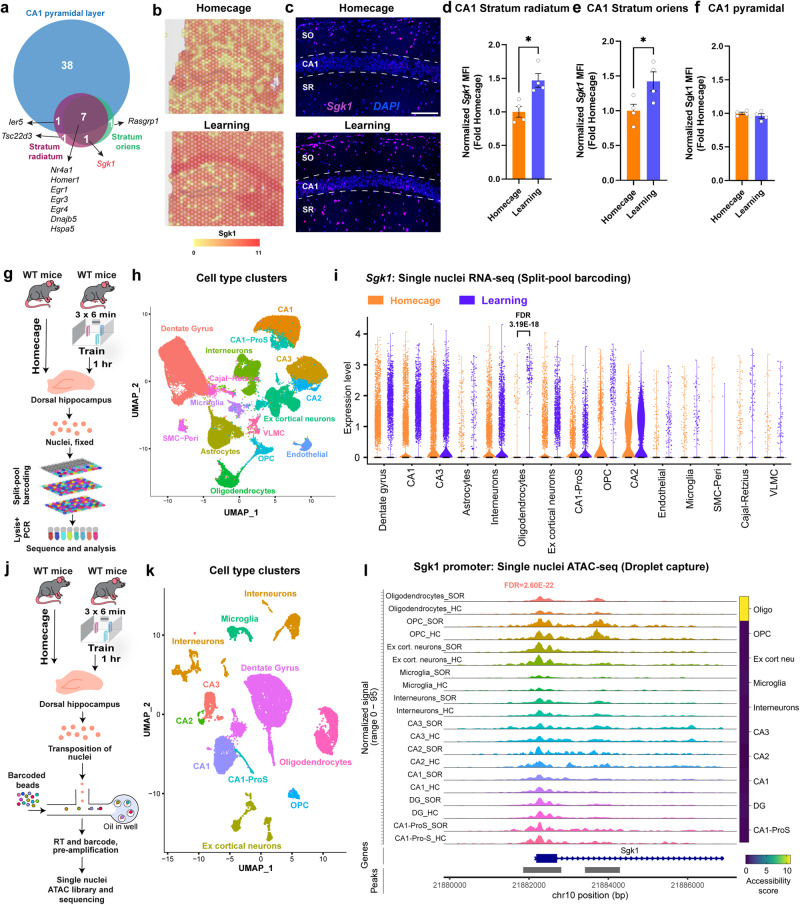
Fig. 5. Region and cell type specific expression of Sgk1.
a Venn diagram showing the overlap of upregulated genes exclusive to area CA1 pyramidal layer, Stratum Oriens, and Stratum Radiatum. b Representative heatmap of spatial gene expression data showing the expression of Sgk1. c In situ hybridization showing expression of Sgk1 in CA1 pyramidal later (CA1), CA1 stratum radiatum (SR) and CA1 stratum oriens (SO) in homecaged (HC) and SOR-trained animals. Scale bar represents 200 μm. d Quantification of the data from c showing Sgk1 expression in SR. Homecage (n = 4), learning (n = 4). Unpaired t test: t (6) = 3.613, p = 0.0112. Error bars represent ± SEM. e Quantification of the data from c showing Sgk1 expression in SO. Homecage (n = 4), learning (n = 4). Unpaired t test: t (6) = 2.541, p = 0.0440. Error bars represent ± SEM. f Quantification of the data from c showing Sgk1 expression in CA1 pyramidal layer. Homecage (n = 4), learning (n = 4). Unpaired t test: t (6) = 1.046, p = 0.3359. Error bars represent ± SEM. g Experimental design of single nuclei RNA seq using split-pool barcoding method. Homecage (n = 6 mice), SOR (n = 6 mice), males only. h UMAP from split-pool barcoding approach showing cell type-specific clusters from the dorsal hippocampus. i Violin plot showing expression of Sgk1 across all the cell types between home cage and learning. j Experimental design of the single nuclei ATAC seq using droplet capture method. (n = 4 mice), SOR (n = 4 mice), males only. k UMAP showing cell type-specific clusters from dorsal hippocampus based on promoter accessibility of marker genes. l Coverage plot showing expression of Sgk1 across all the cell types between home cage and learning. The quantification of differential accessibility (accessibility score) of the Sgk1 promoter after SOR is represented by the heatmap on the right. The accessibility score was calculated by multiplying fold change with -log10 p value.

