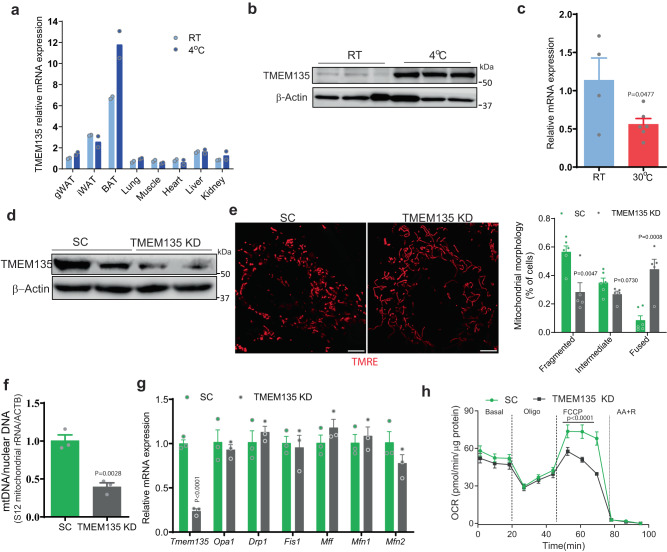
Fig. 3. TMEM135 expression is regulated by thermogenic stimuli and its knockdown impairs mitochondrial fission and respiration in brown adipocytes.
a qPCR analysis of Tmem135 expression in major tissues of wild-type C57BL/6 J mice maintained at room temperature or subjected to cold treatment for 7 days; n = 2/condition. b Western blot analysis of TMEM135 protein levels in BAT of wild-type C57BL/6J mice kept at room temperature or cold treated for 7 days. Each lane represents a separate mouse; n = 3. c qPCR analysis of Tmem135 in BAT of wild-type C57BL/6J mice kept at room temperature (RT) or thermoneutrality (30 oC) for 12 days; RT: n = 4; 30 oC: n = 6. d Western blot analysis of TMEM135 protein levels in brown adipocytes treated with scrambled (SC) or TMEM135 shRNA. e Mitochondrial morphology analysis using confocal microscopy in TMRE-stained brown adipocytes treated with scrambled (SC) (n = 6) or TMEM135 shRNA (n = 5). Plot shows quantification of mitochondrial morphology. Scale bar: 5 μm. f mtDNA copy number normalized to nuclear DNA of brown adipocytes treated with scrambled (SC) (n = 3) or TMEM135 shRNA (n = 3). g qPCR analysis of mitochondrial dynamics genes in brown adipocytes treated with scrambled (SC) (n = 3) or TMEM135 shRNA (n = 3). h OCR measured in brown adipocytes treated with scrambled (SC) (n = 5) or TMEM135 shRNA (n = 3) using a Seahorse XF24 Extracellular Flux Analyzer. Oligo oligomycin, FCCP carbonyl cyanide-p-trifluoromethoxyphenylhydrazone, AA + R, mixture of antimycin A and rotenone. Data are presented as mean ± SEM; statistical significance was determined by two-tailed unpaired Student’s t test (c, e–g) or 2-way ANOVA with Bonferroni’s post hoc test (h).

