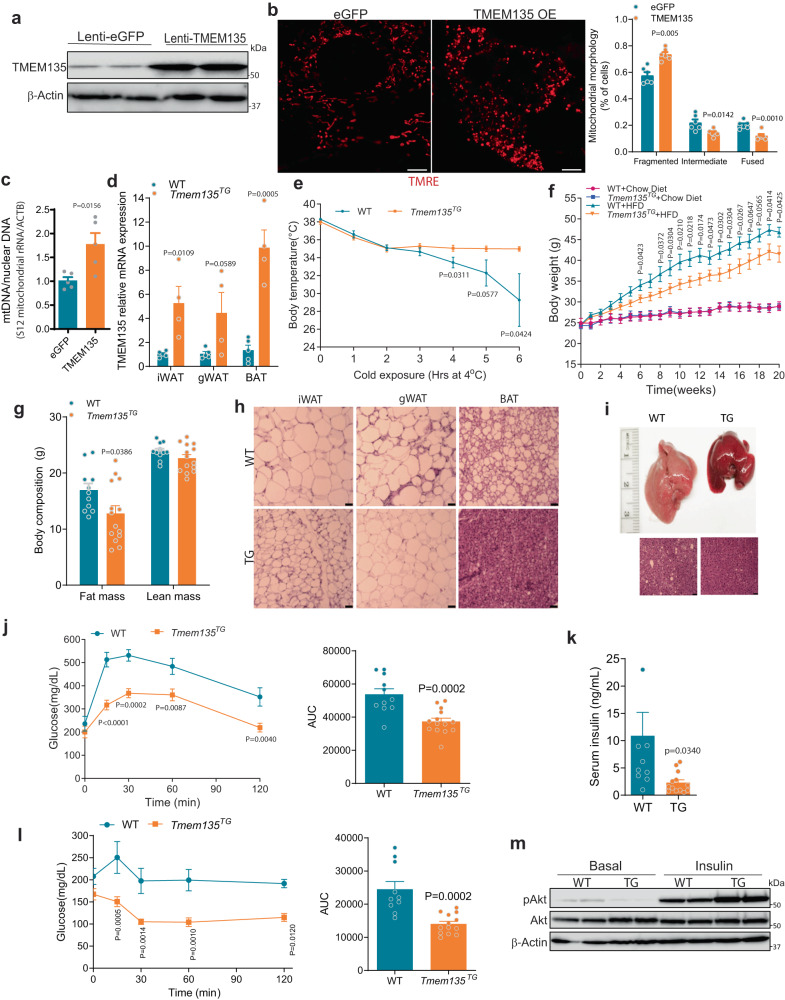
Fig. 5. TMEM135 overexpression increases mitochondrial fission and thermogenesis, decreases diet-induced obesity, and promotes insulin sensitivity.
a Western blot analysis of TMEM135 protein levels in brown adipocytes transduced with lentivirus expressing GFP or TMEM135. The blots are representative of three independent experiments. b Mitochondrial morphology analysis using confocal microscopy in TMRE-stained of brown adipocytes expressing GFP (n = 6) or TMEM135 (n = 6). Plot shows quantification of mitochondrial morphology. Scale bar: 5 μm. c mtDNA copy number normalized to nuclear DNA of brown adipocytes expressing GFP (n = 5) or TMEM135 (n = 5). d qPCR analysis of Tmem135 in various adipose depots of Tmem135TG (n = 4) and WT (n = 5) mice. e Body temperature of Tmem135TG (n = 7) and WT (n = 5) mice kept in warm room (30 oC) for 12 days and then subjected to a 6-h cold challenge. f Body weight of chow diet or HFD-fed Tmem135TG and WT male mice; chow diet (WT: n = 5; Tmem135TG: n = 5) and HFD (WT: n = 11; Tmem135TG: n = 14). g EchoMRI analysis of body composition in HFD-fed Tmem135TG (n = 14) and WT (n = 11) male mice. h H&E staining of adipose tissue depots in HFD-fed Tmem135TG and WT mice. Scale bar: 50 μm. The images are representative results of three independent experiments. i Gross images and H&E staining of liver in HFD-fed Tmem135TG and WT male mice. Scale bar: 50 μm. The images are representative of three mice per group. j Glucose tolerance testing and AUC in HFD-fed Tmem135TG (n = 14) and WT (n = 11) male mice. k Fasting serum insulin level of HFD-fed Tmem135TG (n = 13) and WT (n = 10) male mice. l Insulin tolerance testing and AUC in HFD-fed Tmem135TG (n = 13) and WT (n = 10) male mice. m Western blot analysis of AKT phosphorylation in livers of HFD-fed Tmem135TG and WT mice collected at 10 min following insulin injection. Each lane represents a separate mouse. Two independent experiments yielded similar results. Data are presented as mean ± SEM; statistical significance was determined by two-tailed unpaired Student’s t test (b–g, k) or 2-way ANOVA with Bonferroni’s post hoc test (j, l).

