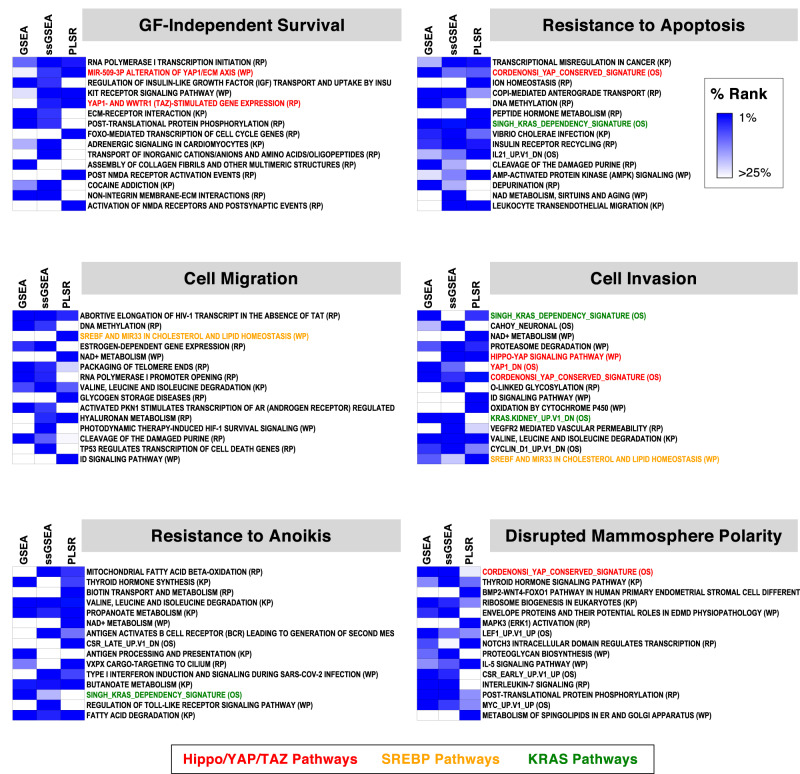
Fig. 4. Transcriptomic profiles of mutant p53-expressing MCF10A cell lines and phenotype-associated pathways.
For the top 15 phenotype-associated pathways for each phenotype selected based on the minimum rank in GSEA, ssGSEA, and PLSR results, the percentile ranks are displayed as heat maps. The pathways discussed in texts are color-coded, as indicated. KP KEGG pathways, RP Reactome pathways, WP WikiPathways, and OS MSigDB Oncogenic Signatures. RNA-Seq and pathway analysis results are in Supplementary Table 2.

