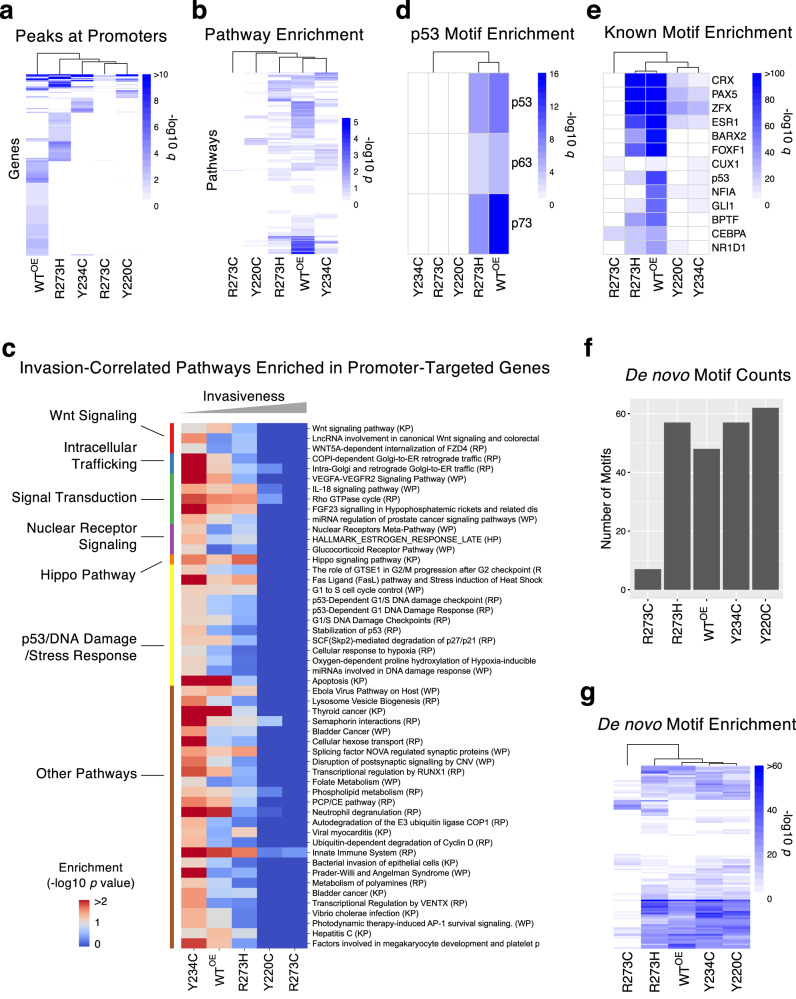
Fig. 6. Characterization of DNA binding properties of 4 different p53 missense mutant proteins by ChIP-Seq.
a Genes that were targeted (peak detection q < 0.05) by WT and mutant p53 proteins at the promoter region are shown as a heat map. The colors represent the −log10 q values. b Enriched pathways (hypergeometric test p < 0.05) in the identified targets of WT and mutant p53 proteins are shown as a heat map of −log10 p values. Representative results based on the WikiPathways pathway set are shown. c Enrichment of the canonical DNA binding motif of the p53 protein family in promoter regions for WT and mutant p53 proteins. The color represents −log10 (hypergeometric test q). d Invasion-correlated (Pearson’s correlation p value < 0.05) pathways that were enriched in target genes (hypergeometric test p value < 0.1) of WT or mutant p53 proteins. The terms were sorted by the pathway groups (shown in left). e Enrichment of top known transcription factor binding motifs within identified peaks for WT and mutant p53 proteins. The color represents −log10 (hypergeometric test q). f The bar plot shows the number of de novo motifs (p < 1.0e-10) found for WT and mutant p53 proteins. g Enrichment profile of de novo binding motifs for WT and mutant p53 proteins are shown. The color represents −log10 (hypergeometric test p). The detailed ChIP-Seq analysis results can be found in Supplementary Table 3.

