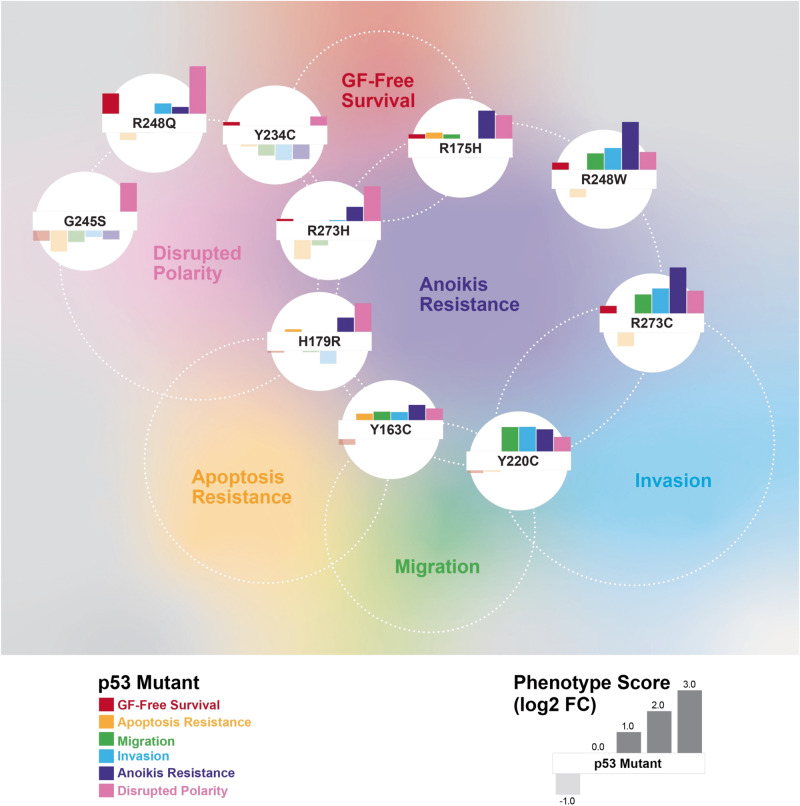
Fig. 8. Overview of heterogeneous functional impact of different p53 missense mutations on cancer hallmark phenotypes.
The normalized phenotypic scores (as log2 fold changes over controls WTOE cells as shown in the legend) for each mutant p53 protein-expressing cells are shown as bar plots. The cell lines were positioned by their relative phenotypic profiles calculated by PCA, while the positions of phenotype names are approximately centered among the cells with more aggressive behavior.

