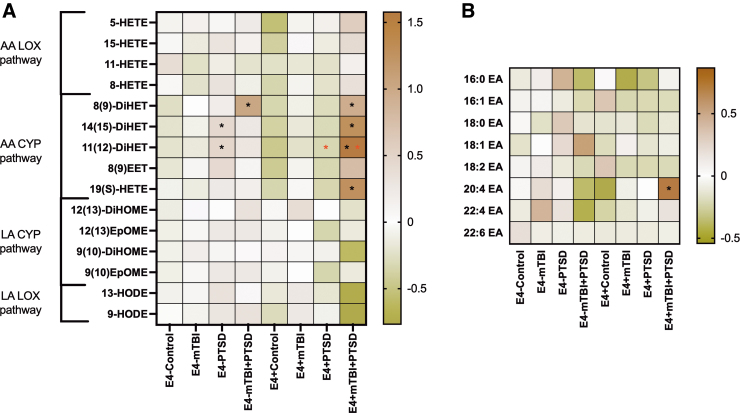
FIG. 4.
Plasma levels of oxylipins produced by LOX and CYP pathways (left) and ethanolamides (right). Heatmap shows the average z-score of all persons within each diagnosis group regarding of their e4 status. Statistics: one-way ANOVA and LSD post hoc comparison followed by BH correction (*BH-corrected p < 0.1). Black asterisks represent significant differences between diagnosis groups and their respective controls within the same genotype group. Red asterisks represent significant differences between non-e4 carriers (e4–) and e4 carriers (e4+) within the same diagnosis group. AA, arachidonic acid; ANOVA, analysis of variance; CYP, cytochrome P450; BH, Benjamini-Hochberg; EA, ethanolamides; LA, linoleic acid; LOX, lipoxygenase; LSD, least significant difference; mTBI, mild traumatic brain injury; PTSD, post-traumatic stress disorder.

